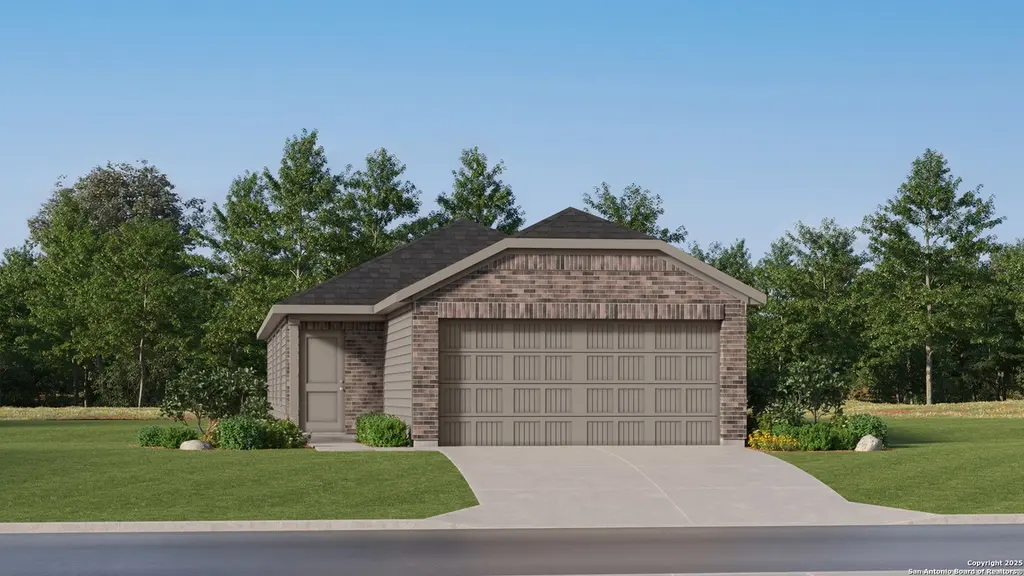
4222 Terrell Trce
San Antonio, TX 78211
$192,999D
3 bd · 2.0 ba ·
1,354 sqft ·
Built 2026
· SingleFamily
· Pending
· 62 DOM
Cashflow @ list (25.0% down · 7.5%)
Estimated rent
$1,546/mo
Mortgage (P&I)
−$1,012
Tax + insurance
−$322
HOA
−$25
Vac / Maint / Mgmt
−$325
Net cashflow
$-137/mo
Annual
$-1,647/yr
Cap rate
5.44%
Cash-on-cash
-3.05%
DSCR
0.86
1% rule
0.80%
Cash to close
$54,040
Investor read
- This is a 3-bed/2.0-bath single-family listed at $193k.
- At list price, monthly cash flow is $-137 ($-2k/yr) — negative.
- To cash-flow at today's rent, offer at most $173k (10.3% below list).
- To meet the 1% rule (rent ≥ 1% of price), the offer needs to be $155k (19.9% below list).
- It's been on market 62 days — a 6% lower offer ($181k) is reasonable based on typical stale-listing flexibility.
- Recommended offer: $155k (19.9% below list) — sets the bar for 1% rule.
- In year one you build about $467 of equity ($1k loan paydown + $-867 appreciation (-0.5% local appreciation)).
- Location reads 80/100 on livability (#31 in TX, #1,616 nationally) — a professional / high-income tenant draw. Strengths: amenities A+, commute A+, cost of living A+; Watch: crime F.
- South San Antonio ISD (urban): math 13% / reading 20% proficiency, ranked #804 of 826 in TX (top 97%) — low school quality limits family demand, transient renter base, plan for 1-2y turnover.
- Zoned schools: Miguel Carrillo Jr El (math 12% / reading 12%, grade F, #4,207 of 4,322 statewide, top 98%, 277 students, 98% FRL); South San Antonio H S (math 27% / reading 32%, grade F, #1,112 of 1,632 statewide, top 70%, 1,786 students, 93% FRL) — zoned schools average 95% FRL vs 42% district-wide (54 pts higher); higher-poverty schools than district average — tighter screening recommended.
- Market conditions: 162 active listings in the ZIP; 26 comparable units currently listed for rent nearby; rentals at typical pace (median 20d on market — plan ~3-4 weeks tenant-placement turnaround); 8,308 units permitted in Bexar County in 2024 (2,506 in 5+ unit buildings).
- Bexar County population projected at +50% by 2050 — long-run rental-demand tailwind backs the buy-and-hold thesis.
- 2 sale attempts; this cycle's ask has dropped $22k (10%) from the opening price — seller is motivated, your offer sets the floor, not the list.
- Cap rate 5.4% vs local median 3.8% in San Antonio — top-decile yield for the area; either an underpriced asset or a hidden risk that comps aren't pricing in. Stress-test before assuming the spread holds.
- This rent runs 33% of the median local income ($55k/yr) — at the standard rent-burdened threshold; future hikes will face affordability resistance.
Questions for listing agent
- What do current leases actually rent for vs. the listed asking? Can we see a recent rent roll and the last 12 months of T-12 income?
- It's been on market 62 days. Have you received any prior offers? Is the seller open to a 20% concession, seller financing, or rate buy-down credit?
- What does the HOA fee cover, when was the last increase, and are there any pending special assessments or reserve-fund shortfalls?
- Why hasn't it sold? Are there any deal-killer items the seller is aware of (foundation, flood, title, zoning, code violations)?
- Is there a deadline driving the sale (1031 exchange, divorce, estate, relocation)? That informs how much negotiation room exists.
- Crime grade is F in this area — have there been break-ins, vandalism, or insurance claims at this property in the last 3 years? What carrier currently insures it and at what premium?
- The area grade is low — what's the realistic commute time and amenity access for the typical tenant pool here? Any planned neighborhood developments (good or bad) we should know about?
- What's the average days-on-market for RENTAL listings here right now (not sales)? A rising rental-DOM trend means longer vacancies and softer asking-rent achievability than the comps imply.
CashFlowRE · CFR-59EBSP01JPVAN0
· Data 4 days ago
cashflowre.app · 2026-05-29