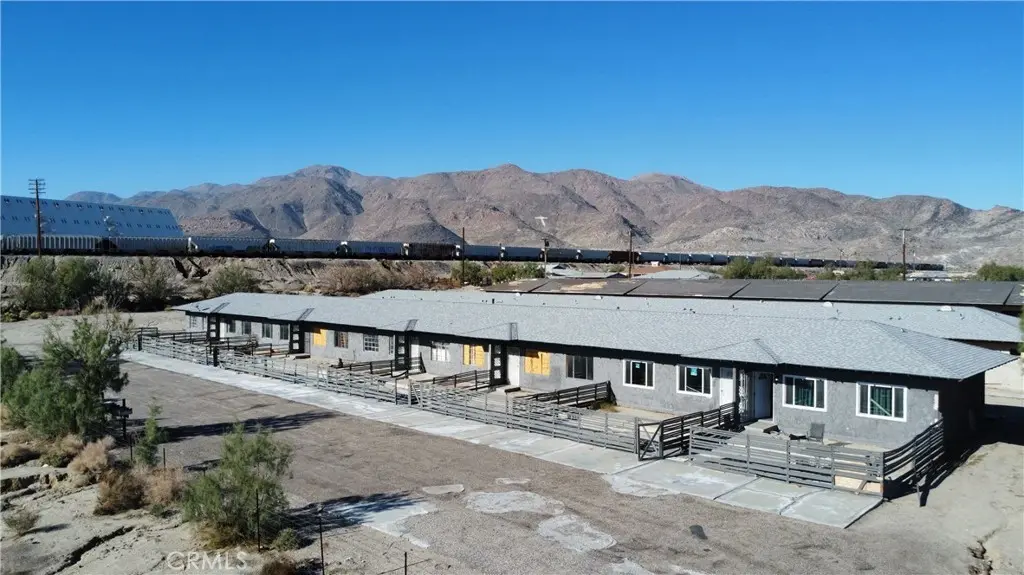
83298 Argus Ave
Searles Valley, CA 93562
$650,000D+
36 bd · 32.0 ba ·
21,660 sqft ·
Built 1948
· MultiFamily
· Active
· 136 DOM
Cashflow @ list (25.0% down · 7.5%)
Estimated rent
$29,700/mo
Mortgage (P&I)
−$3,409
Tax + insurance
−$2,756
HOA
−$0
Vac / Maint / Mgmt
−$6,237
Net cashflow
$17,299/mo
Annual
$207,585/yr
Cap rate
38.23%
Cash-on-cash
114.06%
DSCR
6.07
1% rule
4.57%
Cash to close
$182,000
Investor read
- This is a 36-bed/32.0-bath multifamily listed at $650k.
- At list price, monthly cash flow is $17k ($208k/yr) — positive.
- The deal already cash-flows at list — no discount required.
- Meets the 1% rule at list price ($30k rent vs $650k).
- It's been on market 136 days — a 12% lower offer ($572k) is reasonable based on typical stale-listing flexibility.
- Recommended offer: $572k (12.0% below list) — sets the bar for market timing.
- In year one you build about $24k of equity ($4k loan paydown + $20k appreciation (3.0% local appreciation)).
- Location reads 62/100 on livability (#500 in CA) — a middle-class / working-renter tenant base. Strengths: cost of living A+, housing A+, crime B; Watch: health & safety C-, schools F, amenities F.
- Trona Joint Unified (rural): math 25% / reading 40% proficiency, ranked #1,004 of 1,400 in CA (top 72%) — families likely to look elsewhere, expect single-tenant / working-renter base with shorter leases; 61% free/reduced lunch — lower-income household profile, screen leases tightly.
- Watch-outs: property tax is 4.6% of price; built in 1948 — expect roof / HVAC / electrical / plumbing capex.
- Market conditions: 56 active listings in the ZIP; 5,458 units permitted in San Bernardino County in 2024 (1,500 in 5+ unit buildings).
- San Bernardino County population projected at +15% by 2050 — modest demand growth; plan on rents tracking national, not racing it.
- 7 sale attempts since 21y ago; this cycle's ask has dropped $100k (13%) from the opening price — seller is motivated, your offer sets the floor, not the list.
- Current owner paid $221k; list at $650k implies a 194% gain — meaningful room to come down on a strong offer.
- At projected returns (3.0% appreciation + 3.0% rent growth), your $182k cash investment doubles in ~1 year — after that, you're playing with house money.
- By year 2, paydown + projected appreciation supports a ~$39k cash-out refi (75% LTV) — recoverable capital for the next deal without selling this one.
- Climate carrying-cost: extreme-heat days projected 8→21/yr by 2055 (HVAC capex compounding) — expect insurance premiums to compound above CPI over the hold.
- Cap rate 38.2% vs local median 10.4% in Searles Valley — top-decile yield for the area; either an underpriced asset or a hidden risk that comps aren't pricing in. Stress-test before assuming the spread holds.
Questions for listing agent
- It's been on market 136 days. Have you received any prior offers? Is the seller open to a 12% concession, seller financing, or rate buy-down credit?
- Built in 1948 — when were the roof, HVAC, electrical panel, plumbing, and water heater last replaced?
- Property tax is high relative to price — has the assessment been appealed recently, and will the sale trigger a re-assessment?
- Why hasn't it sold? Are there any deal-killer items the seller is aware of (foundation, flood, title, zoning, code violations)?
- Is there a deadline driving the sale (1031 exchange, divorce, estate, relocation)? That informs how much negotiation room exists.
- Schools are F-rated, which usually means shorter tenancies and higher turnover. Who's the typical renter profile here, and what's been the actual vacancy rate?
- The area grade is low — what's the realistic commute time and amenity access for the typical tenant pool here? Any planned neighborhood developments (good or bad) we should know about?
- What's the average days-on-market for RENTAL listings here right now (not sales)? A rising rental-DOM trend means longer vacancies and softer asking-rent achievability than the comps imply.
CashFlowRE · CFR-5AFXGEENDY4EAD
· Data 2 days ago
cashflowre.app · 2026-05-29