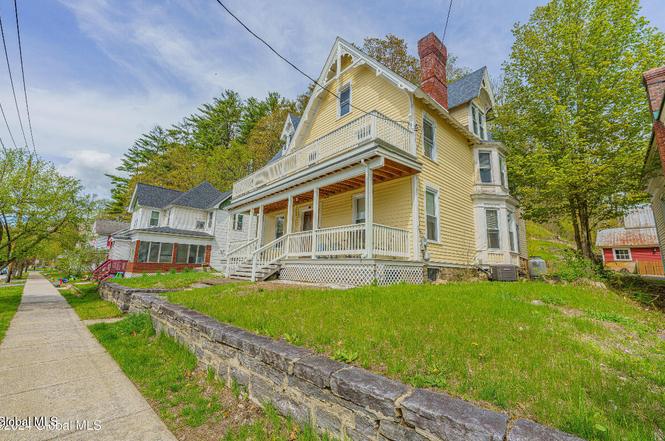
28 Main St
Lake Luzerne, NY 12846
$225,000B+
5 bd · 2.5 ba ·
2,704 sqft ·
Built 1930
· SingleFamily
· Pending
· 175 DOM
Cashflow @ list (25.0% down · 7.5%)
Estimated rent
$3,218/mo
Mortgage (P&I)
−$1,180
Tax + insurance
−$463
HOA
−$0
Vac / Maint / Mgmt
−$676
Net cashflow
$899/mo
Annual
$10,793/yr
Cap rate
11.39%
Cash-on-cash
18.19%
DSCR
1.81
1% rule
1.43%
Cash to close
$63,000
Investor read
- This is a 5-bed/2.5-bath single-family listed at $225k.
- At list price, monthly cash flow is $899 ($11k/yr) — positive.
- The deal already cash-flows at list — no discount required.
- Meets the 1% rule at list price ($3k rent vs $225k).
- It's been on market 175 days — a 12% lower offer ($198k) is reasonable based on typical stale-listing flexibility.
- Recommended offer: $198k (12.0% below list) — sets the bar for market timing.
- In year one you build about $24k of equity ($2k loan paydown + $22k appreciation (10.0% local appreciation)).
- Location reads 65/100 on livability (#682 in NY) — a middle-class / working-renter tenant base. Strengths: housing A+, crime A; Watch: amenities F, commute F, health & safety D-.
- Hadley-Luzerne Central School District (rural): math 41% / reading 57% proficiency, ranked #396 of 590 in NY (top 67%) — families likely to look elsewhere, expect single-tenant / working-renter base with shorter leases.
- Zoned schools: Hadley-Luzerne Junior-Senior High School (math 62% / reading 67%, grade B-, #776 of 1,100 statewide, top 73%, 304 students, 54% FRL).
- Zoned-school proficiency averages 64% at this address vs 49% district-wide (+16 pts) — the actual schools serving this property are materially stronger than the Hadley-Luzerne Central School District average implies; a family-tenant draw the district grade alone would hide.
- Watch-outs: flood insurance adds $56/mo; built in 1930 — expect roof / HVAC / electrical / plumbing capex.
- Market conditions: 39 active listings in the ZIP; 180 units permitted in Warren County in 2024 (40 in 5+ unit buildings).
- Warren County population projected at -19% by 2050 — secular population decline; favor cash flow + early exit over multi-decade hold.
- 4 sale attempts since 2y ago with the ask held roughly flat each time — persistent listings suggest the price (not the market) is what's stuck; bring a comps-based counter.
- At projected returns (10.0% appreciation + 3.0% rent growth), your $63k cash investment doubles in ~2 years — after that, you're playing with house money.
- By year 2, paydown + projected appreciation supports a ~$39k cash-out refi (75% LTV) — recoverable capital for the next deal without selling this one.
- Climate carrying-cost: severe flood risk — expect insurance premiums to compound above CPI over the hold.
Questions for listing agent
- It's been on market 175 days. Have you received any prior offers? Is the seller open to a 12% concession, seller financing, or rate buy-down credit?
- Built in 1930 — when were the roof, HVAC, electrical panel, plumbing, and water heater last replaced?
- What's the actual annual flood-insurance premium (NFIP or private), and is the property in a SFHA with mandatory coverage?
- Why hasn't it sold? Are there any deal-killer items the seller is aware of (foundation, flood, title, zoning, code violations)?
- Is there a deadline driving the sale (1031 exchange, divorce, estate, relocation)? That informs how much negotiation room exists.
- What's the average days-on-market for RENTAL listings here right now (not sales)? A rising rental-DOM trend means longer vacancies and softer asking-rent achievability than the comps imply.
- What's the recent tenant-quality profile in this submarket — average credit score on applications, eviction rate, late-payment / NSF rate, and stable-employment percentage? A property-management company in the area should have these aggregated.
- How much new for-sale + rental construction is in the pipeline within 1–3 miles? Heavy new supply typically softens prices + rents 12–24 months out; constrained supply supports both.
CashFlowRE · CFR-5ASY1Y421DT757
· Data 3 weeks ago
cashflowre.app · 2026-05-29