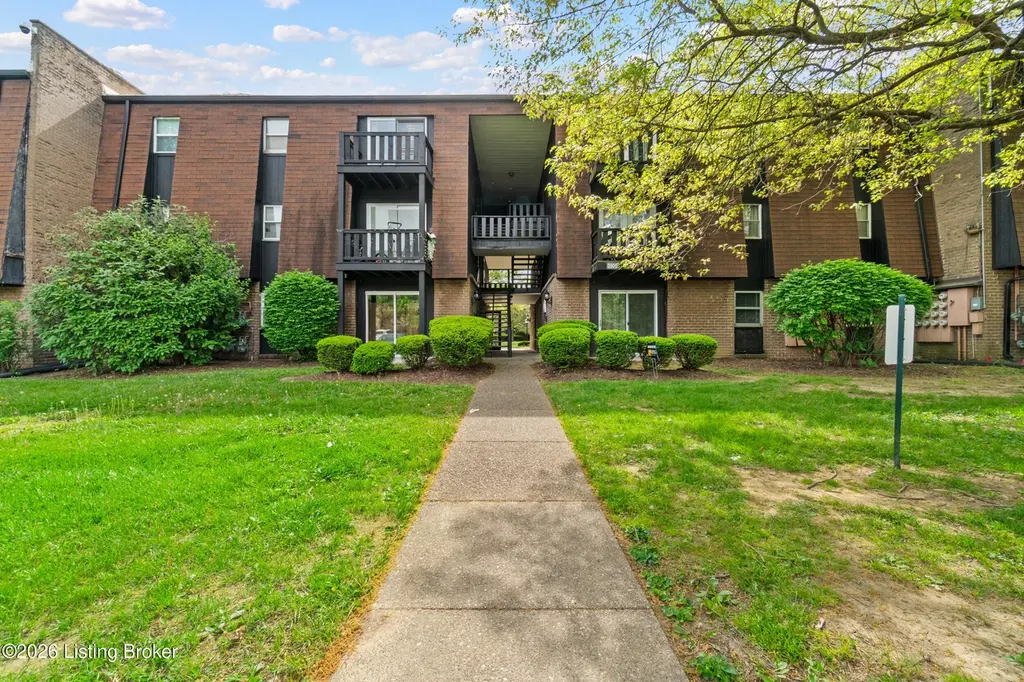
3505 Lodge Ln #210
Louisville/Jefferson County metro government (balance), KY 40218
$124,500F
2 bd · 1.5 ba ·
846 sqft ·
Built 1979
· Condo
· Active
· 20 DOM
Cashflow @ list (25.0% down · 7.5%)
Estimated rent
$1,128/mo
Mortgage (P&I)
−$653
Tax + insurance
−$164
HOA
−$384
Vac / Maint / Mgmt
−$237
Net cashflow
$-310/mo
Annual
$-3,717/yr
Cap rate
3.31%
Cash-on-cash
-10.66%
DSCR
0.53
1% rule
0.91%
Cash to close
$34,860
Investor read
- This is a 2-bed/1.5-bath condo listed at $124k.
- At list price, monthly cash flow is $-310 ($-4k/yr) — negative.
- The deal already cash-flows at list — no discount required.
- To meet the 1% rule (rent ≥ 1% of price), the offer needs to be $113k (9.4% below list).
- It's been on market 20 days — a 2% lower offer ($123k) is reasonable based on typical stale-listing flexibility.
- Recommended offer: $113k (9.4% below list) — sets the bar for 1% rule.
- Local home prices are declining (-3.0%/yr); year-one equity from $861 of loan paydown is wiped out by about $4k of value loss. Plan a longer hold.
- Location reads: area grade F — affects rentability + tenant quality, not the cash-flow math above.
- Jefferson County (urban): math 19% / reading 35% proficiency, ranked #121 of 165 in KY (top 73%) — low school quality limits family demand, transient renter base, plan for 1-2y turnover.
- Zoned schools: Watterson Elementary (math 8% / reading 17%, grade F, #630 of 676 statewide, top 95%, 494 students, 70% FRL); Ramsey Middle (math 11% / reading 34%, grade F, #200 of 217 statewide, top 93%, 1,008 students, 62% FRL); Seneca High (math 8% / reading 17%, grade F, #228 of 254 statewide, top 91%, 1,309 students, 64% FRL).
- Watch-outs: HOA is 34% of rent.
- Market conditions: Rents falling (-3.5%/yr); 103 active listings in the ZIP; 37 comparable units currently listed for rent nearby; rentals at typical pace (median 18d on market — plan ~3-4 weeks tenant-placement turnaround); 2,836 units permitted in Jefferson County in 2024 (1,558 in 5+ unit buildings).
- Jefferson County population projected at +13% by 2050 — modest demand growth; plan on rents tracking national, not racing it.
- 2 sale attempts since 3y ago with the ask held roughly flat each time — persistent listings suggest the price (not the market) is what's stuck; bring a comps-based counter.
- Climate carrying-cost: extreme-heat days projected 7→19/yr by 2055 (HVAC capex compounding) — expect insurance premiums to compound above CPI over the hold.
Questions for listing agent
- What do current leases actually rent for vs. the listed asking? Can we see a recent rent roll and the last 12 months of T-12 income?
- Built in 1979 — when were the roof, HVAC, electrical panel, plumbing, and water heater last replaced?
- What does the HOA fee cover, when was the last increase, and are there any pending special assessments or reserve-fund shortfalls?
- Any open or pending special assessments — roof, HVAC, plumbing, elevator, façade? What's the per-unit balance and payoff schedule, and is the seller paying it off at close or rolling it to the buyer?
- Is there a deadline driving the sale (1031 exchange, divorce, estate, relocation)? That informs how much negotiation room exists.
- The area grade is low — what's the realistic commute time and amenity access for the typical tenant pool here? Any planned neighborhood developments (good or bad) we should know about?
- What's the average days-on-market for RENTAL listings here right now (not sales)? A rising rental-DOM trend means longer vacancies and softer asking-rent achievability than the comps imply.
- What's the recent tenant-quality profile in this submarket — average credit score on applications, eviction rate, late-payment / NSF rate, and stable-employment percentage? A property-management company in the area should have these aggregated.
CashFlowRE · CFR-5EDJYE5W6TCHN3
· Data 1 day ago
cashflowre.app · 2026-05-29