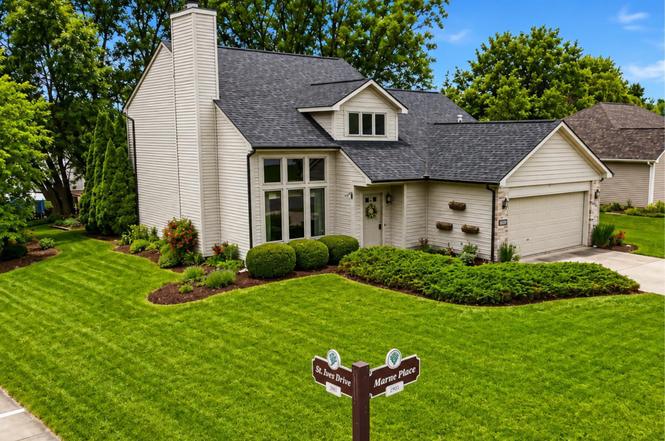
2903 Marne Pl
Fort Wayne, IN 46818
$320,000D-
3 bd · 2.5 ba ·
1,879 sqft ·
Built 2001
· SingleFamily
· Pending
· 2 DOM
Cashflow @ list (25.0% down · 7.5%)
Estimated rent
$2,410/mo
Mortgage (P&I)
−$1,678
Tax + insurance
−$359
HOA
−$15
Vac / Maint / Mgmt
−$506
Net cashflow
$-148/mo
Annual
$-1,776/yr
Cap rate
5.74%
Cash-on-cash
-1.98%
DSCR
0.91
1% rule
0.75%
Cash to close
$89,600
Investor read
- This is a 3-bed/2.5-bath single-family listed at $320k.
- At list price, monthly cash flow is $-148 ($-2k/yr) — negative.
- To cash-flow at today's rent, offer at most $294k (8.2% below list).
- To meet the 1% rule (rent ≥ 1% of price), the offer needs to be $241k (24.7% below list).
- Only 2 days on market — expect competitive offers; lowballing is unlikely to land.
- Recommended offer: $241k (24.7% below list) — sets the bar for 1% rule.
- Local home prices are declining (-3.0%/yr); year-one equity from $2k of loan paydown is wiped out by about $10k of value loss. Plan a longer hold.
- Location reads 84/100 on livability (#6 in IN, #676 nationally) — a professional / high-income tenant draw. Strengths: amenities A+, commute A+, cost of living A+; Watch: crime C-, employment D+.
- Northwest Allen County Schools (rural): math 51% / reading 58% proficiency, ranked #25 of 301 in IN (top 8%) — acceptable for families but not a draw, mixed tenant base, ~2y average lease; only 11% free/reduced lunch — higher-income household profile.
- Zoned schools: Hickory Center Elementary School (math 60% / reading 54%, grade C+, #172 of 994 statewide, top 18%, 462 students, 25% FRL); Carroll Middle School (math 39% / reading 55%, grade D+, #65 of 330 statewide, top 21%, 994 students, 29% FRL); Carroll High School (math 59% / reading 86%, grade B+, #10 of 369 statewide, top 3%, 2,554 students, 21% FRL).
- Market conditions: Rents rising fast (+7.6%/yr); 327 active listings in the ZIP; 3 comparable units currently listed for rent nearby; rentals lingering (median 44d on market — plan ~5-8 weeks vacancy on turnover, expect pricing pressure); 67% of comp listings sitting > 30 days — soft ceiling on asking rent; solid renter incomes; 1,861 units permitted in Allen County in 2024 (576 in 5+ unit buildings).
- Allen County population projected at +10% by 2050 — modest demand growth; plan on rents tracking national, not racing it.
- Cap rate 5.7% vs local median 4.8% in Fort Wayne — meaningfully above typical; check what's discounted (condition, days-on-market, listing class) to confirm the premium yield is real.
- This rent runs 36% of the median local income ($81k/yr) — at the standard rent-burdened threshold; future hikes will face affordability resistance.
Questions for listing agent
- What do current leases actually rent for vs. the listed asking? Can we see a recent rent roll and the last 12 months of T-12 income?
- What does the HOA fee cover, when was the last increase, and are there any pending special assessments or reserve-fund shortfalls?
- Is there a deadline driving the sale (1031 exchange, divorce, estate, relocation)? That informs how much negotiation room exists.
- Schools are D-rated, which usually means shorter tenancies and higher turnover. Who's the typical renter profile here, and what's been the actual vacancy rate?
- The area grade is low — what's the realistic commute time and amenity access for the typical tenant pool here? Any planned neighborhood developments (good or bad) we should know about?
- What's the average days-on-market for RENTAL listings here right now (not sales)? A rising rental-DOM trend means longer vacancies and softer asking-rent achievability than the comps imply.
- What's the recent tenant-quality profile in this submarket — average credit score on applications, eviction rate, late-payment / NSF rate, and stable-employment percentage? A property-management company in the area should have these aggregated.
- How much new for-sale + rental construction is in the pipeline within 1–3 miles? Heavy new supply typically softens prices + rents 12–24 months out; constrained supply supports both.
CashFlowRE · CFR-5FD3NA7B6PRTZZ
· Data 3 days ago
cashflowre.app · 2026-05-29