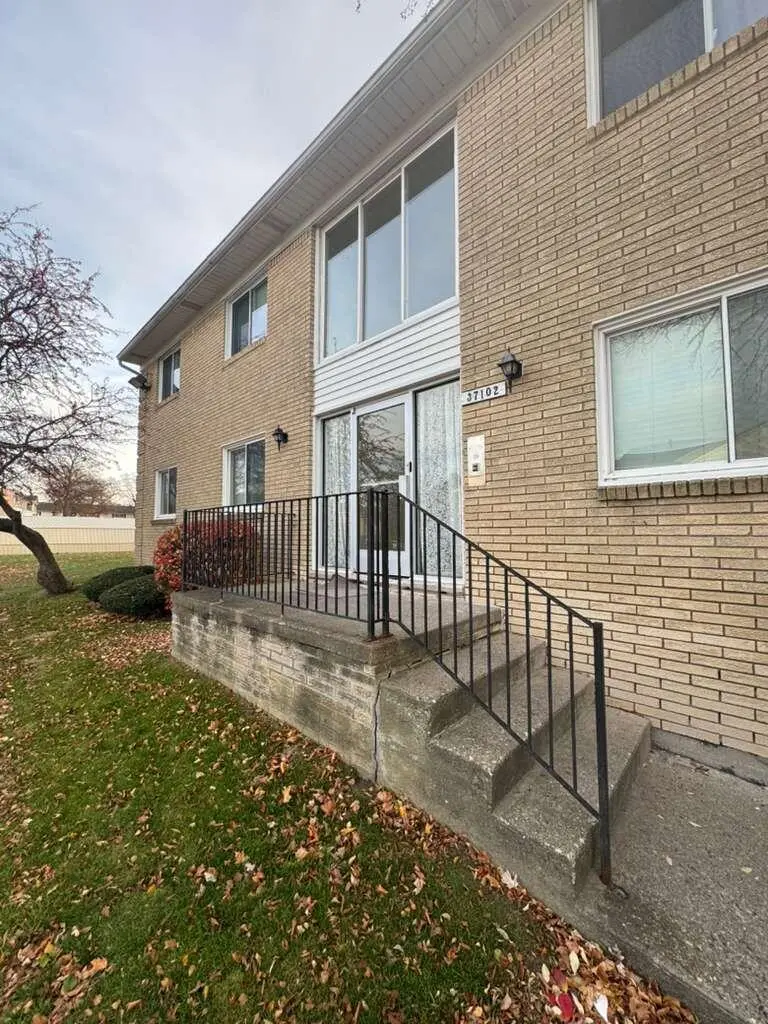
37102 Aberdeen Dr #10
Sterling Heights, MI 48312
$140,000C-
2 bd · 2.0 ba ·
984 sqft ·
Built 1972
· Condo
· Active
· 36 DOM
Cashflow @ list (25.0% down · 7.5%)
Estimated rent
$1,493/mo
Mortgage (P&I)
−$734
Tax + insurance
−$233
HOA
−$0
Vac / Maint / Mgmt
−$313
Net cashflow
$212/mo
Annual
$2,540/yr
Cap rate
8.11%
Cash-on-cash
6.48%
DSCR
1.29
1% rule
1.07%
Cash to close
$39,200
Investor read
- This is a 2-bed/2.0-bath condo listed at $140k. Condition is rated average.
- At list price, monthly cash flow is $212 ($3k/yr) — positive.
- The deal already cash-flows at list — no discount required.
- Meets the 1% rule at list price ($1k rent vs $140k).
- It's been on market 36 days — a 3% lower offer ($136k) is reasonable based on typical stale-listing flexibility.
- Recommended offer: $136k (3.0% below list) — sets the bar for market timing.
- Local home prices are declining (-3.0%/yr); year-one equity from $968 of loan paydown is wiped out by about $4k of value loss. Plan a longer hold.
- Location reads 74/100 on livability (#173 in MI, #4,545 nationally) — a middle-class / working-renter tenant base. Strengths: commute A+, cost of living A+, housing A+; Watch: health & safety D+, amenities F.
- Utica Community Schools (suburban): math 38% / reading 53% proficiency, ranked #126 of 540 in MI (top 23%) — families likely to look elsewhere, expect single-tenant / working-renter base with shorter leases.
- Zoned schools: Oakbrook Elementary School (math 37% / reading 49%, grade F, #540 of 1,397 statewide, top 39%, 535 students, 60% FRL); Heritage Junior High School (math 39% / reading 49%, grade D, #173 of 493 statewide, top 36%, 448 students, 51% FRL); Adlai Stevenson High School (math 32% / reading 54%, grade F, #260 of 713 statewide, top 37%, 1,977 students, 55% FRL) — zoned schools average 55% FRL vs 26% district-wide (29 pts higher); higher-poverty schools than district average — tighter screening recommended.
- Market conditions: 163 active listings in the ZIP; 28 comparable units currently listed for rent nearby; rentals at typical pace (median 15d on market — plan ~3-4 weeks tenant-placement turnaround); 1,321 units permitted in Macomb County in 2024 (86 in 5+ unit buildings).
- Macomb County population projected at +9% by 2050 — modest demand growth; plan on rents tracking national, not racing it.
- 5 sale attempts since 12y ago; this cycle's ask has dropped $10k (7%) from the opening price — seller is motivated, your offer sets the floor, not the list.
- Cap rate 8.1% vs local median 3.8% in Sterling Heights — top-decile yield for the area; either an underpriced asset or a hidden risk that comps aren't pricing in. Stress-test before assuming the spread holds.
Questions for listing agent
- It's been on market 36 days. Have you received any prior offers? Is the seller open to a 3% concession, seller financing, or rate buy-down credit?
- Built in 1972 — when were the roof, HVAC, electrical panel, plumbing, and water heater last replaced?
- Any open or pending special assessments — roof, HVAC, plumbing, elevator, façade? What's the per-unit balance and payoff schedule, and is the seller paying it off at close or rolling it to the buyer?
- Is there a deadline driving the sale (1031 exchange, divorce, estate, relocation)? That informs how much negotiation room exists.
- What's the average days-on-market for RENTAL listings here right now (not sales)? A rising rental-DOM trend means longer vacancies and softer asking-rent achievability than the comps imply.
- What's the recent tenant-quality profile in this submarket — average credit score on applications, eviction rate, late-payment / NSF rate, and stable-employment percentage? A property-management company in the area should have these aggregated.
- How much new apartment / multifamily construction is in the pipeline within 1–3 miles? Heavy new supply (>2% of stock underway) typically softens rents 12–24 months out; light construction supports rent growth.
Repairs flagged (vision-AI assessment)
- Minor: exterior siding — Weathered appearance
- Minor: interior paint — Slightly faded
CashFlowRE · CFR-5G1BQ05CN704DS
· Data 23 h ago
cashflowre.app · 2026-05-29