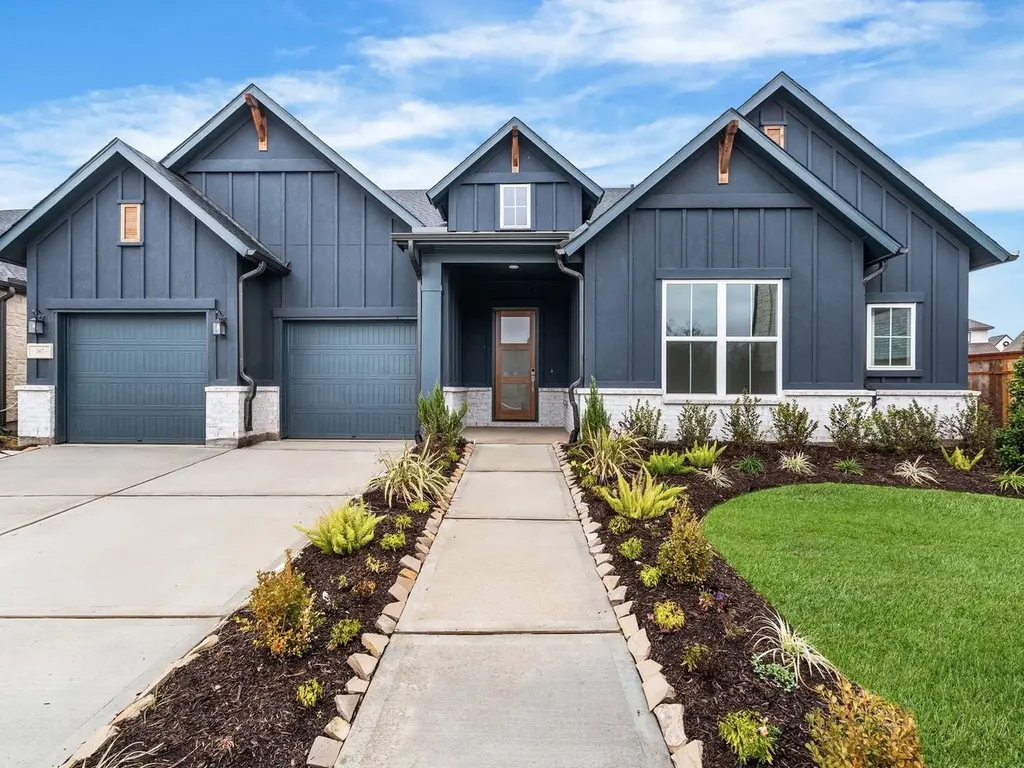
1807 Watermont Dr
Sienna, TX 77459
$535,000D-
4 bd · 3.0 ba ·
3,078 sqft ·
Built 2025
· Land
· Pending
· 332 DOM
Cashflow @ list (25.0% down · 7.5%)
Estimated rent
$3,536/mo
Mortgage (P&I)
−$2,806
Tax + insurance
−$353
HOA
−$119
Vac / Maint / Mgmt
−$743
Net cashflow
$-484/mo
Annual
$-5,812/yr
Cap rate
5.21%
Cash-on-cash
-3.88%
DSCR
0.83
1% rule
0.66%
Cash to close
$149,800
Investor read
- This is a 4-bed/3.0-bath land listed at $535k.
- At list price, monthly cash flow is $-484 ($-6k/yr) — negative.
- To cash-flow at today's rent, offer at most $449k (16.0% below list).
- To meet the 1% rule (rent ≥ 1% of price), the offer needs to be $354k (33.9% below list).
- It's been on market 332 days — a 12% lower offer ($471k) is reasonable based on typical stale-listing flexibility.
- Recommended offer: $354k (33.9% below list) — sets the bar for 1% rule.
- Local home prices are declining (-1.7%/yr); year-one equity from $4k of loan paydown is wiped out by about $9k of value loss. Plan a longer hold.
- Location reads: area grade D — affects rentability + tenant quality, not the cash-flow math above.
- Fort Bend ISD (suburban): math 44% / reading 53% proficiency, ranked #140 of 826 in TX (top 17%) — families likely to look elsewhere, expect single-tenant / working-renter base with shorter leases.
- Zoned schools: Heritage Rose El (math 29% / reading 28%, grade F, #2,706 of 4,322 statewide, top 63%, 1,209 students, 83% FRL); Billy Baines Middle (math 47% / reading 53%, grade C, #347 of 1,662 statewide, top 21%, 1,296 students, 37% FRL); Ridge Point H S (math 61% / reading 69%, grade B, #198 of 1,632 statewide, top 12%, 3,170 students, 31% FRL) — zoned schools average 50% FRL vs 35% district-wide (15 pts higher); higher-poverty schools than district average — tighter screening recommended.
- Market conditions: Rents soft (-0.1%/yr); 1234 active listings in the ZIP; 1 comparable units currently listed for rent nearby; high-income renter base; 12,093 units permitted in Fort Bend County in 2024 (815 in 5+ unit buildings).
- Fort Bend County population projected at +75% by 2050 — long-run rental-demand tailwind backs the buy-and-hold thesis.
- Climate carrying-cost: severe wind risk, 99% chance of damaging wind over 30y; extreme-heat days projected 7→22/yr by 2055 (HVAC capex compounding) — expect insurance premiums to compound above CPI over the hold.
- Cap rate 5.2% vs local median 3.3% in Sienna — top-decile yield for the area; either an underpriced asset or a hidden risk that comps aren't pricing in. Stress-test before assuming the spread holds.
- This rent runs 33% of the median local income ($129k/yr) — at the standard rent-burdened threshold; future hikes will face affordability resistance.
Questions for listing agent
- What do current leases actually rent for vs. the listed asking? Can we see a recent rent roll and the last 12 months of T-12 income?
- It's been on market 332 days. Have you received any prior offers? Is the seller open to a 34% concession, seller financing, or rate buy-down credit?
- What does the HOA fee cover, when was the last increase, and are there any pending special assessments or reserve-fund shortfalls?
- Why hasn't it sold? Are there any deal-killer items the seller is aware of (foundation, flood, title, zoning, code violations)?
- Is there a deadline driving the sale (1031 exchange, divorce, estate, relocation)? That informs how much negotiation room exists.
- The area grade is low — what's the realistic commute time and amenity access for the typical tenant pool here? Any planned neighborhood developments (good or bad) we should know about?
- What's the average days-on-market for RENTAL listings here right now (not sales)? A rising rental-DOM trend means longer vacancies and softer asking-rent achievability than the comps imply.
- What's the recent tenant-quality profile in this submarket — average credit score on applications, eviction rate, late-payment / NSF rate, and stable-employment percentage? A property-management company in the area should have these aggregated.
CashFlowRE · CFR-5GWK1Z6PYKR4HH
· Data 2 weeks ago
cashflowre.app · 2026-05-29