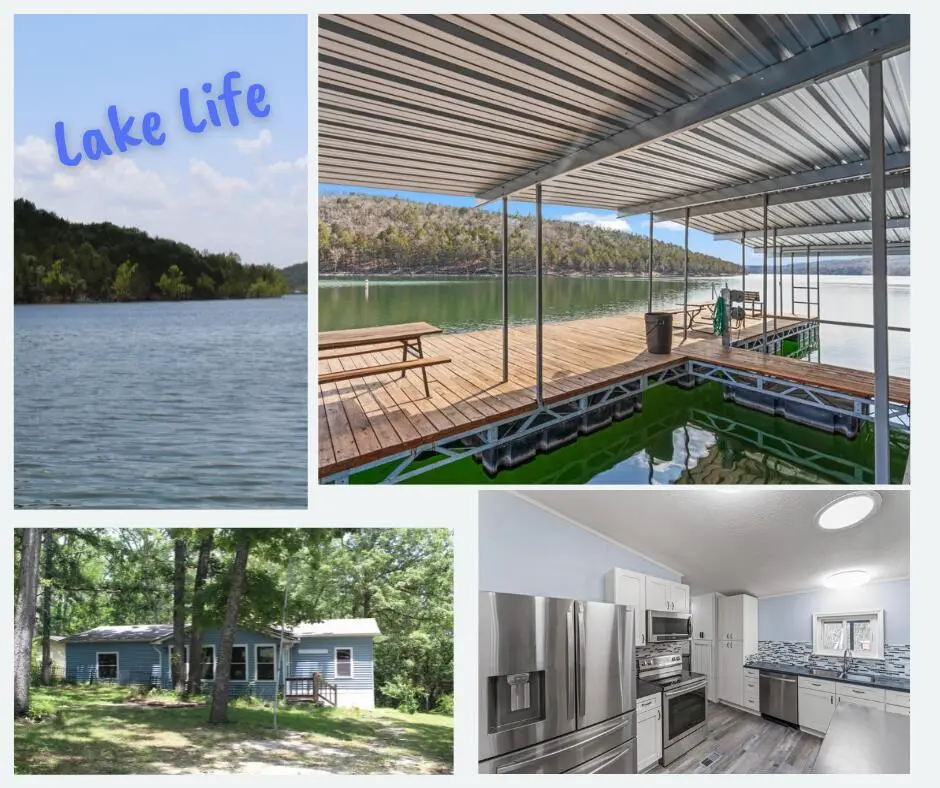
60 Belle Hvn
Kimberling City, MO 65656
$199,000D
3 bd · 2.0 ba ·
1,800 sqft ·
Built 1994
· Manufactured
· Pending
· 468 DOM
Cashflow @ list (25.0% down · 7.5%)
Estimated rent
$1,197/mo
Mortgage (P&I)
−$1,044
Tax + insurance
−$332
HOA
−$0
Vac / Maint / Mgmt
−$251
Net cashflow
$-429/mo
Annual
$-5,152/yr
Cap rate
3.70%
Cash-on-cash
-9.25%
DSCR
0.59
1% rule
0.60%
Cash to close
$55,720
Investor read
- This is a 3-bed/2.0-bath manufactured listed at $199k.
- At list price, monthly cash flow is $-429 ($-5k/yr) — negative.
- To cash-flow at today's rent, offer at most $137k (31.2% below list).
- To meet the 1% rule (rent ≥ 1% of price), the offer needs to be $120k (39.8% below list).
- It's been on market 468 days — a 12% lower offer ($175k) is reasonable based on typical stale-listing flexibility.
- Recommended offer: $120k (39.8% below list) — sets the bar for 1% rule.
- In year one you build about $21k of equity ($1k loan paydown + $20k appreciation (10.0% local appreciation)).
- Location reads 69/100 on livability (#162 in MO) — a middle-class / working-renter tenant base. Strengths: crime A+, cost of living A+, housing A+; Watch: health & safety C-, employment D, amenities F.
- Reeds Spring R-IV (rural): math 34% / reading 42% proficiency, ranked #182 of 324 in MO (top 56%) — families likely to look elsewhere, expect single-tenant / working-renter base with shorter leases.
- Zoned schools: Reeds Spring Elem. (math 33% / reading 33%, grade F, #744 of 1,115 statewide, top 67%, 358 students, 62% FRL); Reeds Spring Middle (math 31% / reading 46%, grade F, #202 of 391 statewide, top 54%, 286 students, 56% FRL); Reeds Spring High (math 32% / reading 47%, grade F, #247 of 521 statewide, top 55%, 602 students, 47% FRL) — zoned schools at 55% FRL track the district average.
- Market conditions: 120 active listings in the ZIP; 191 units permitted in Stone County in 2024 (0 in 5+ unit buildings).
- Stone County population projected at -30% by 2050 — secular population decline; favor cash flow + early exit over multi-decade hold.
- 3 sale attempts since 8y ago; this cycle's ask has dropped $100k (33%) from the opening price — seller is motivated, your offer sets the floor, not the list.
- By year 2, paydown + projected appreciation supports a ~$34k cash-out refi (75% LTV) — recoverable capital for the next deal without selling this one.
- Climate carrying-cost: extreme-heat days projected 7→20/yr by 2055 (HVAC capex compounding) — expect insurance premiums to compound above CPI over the hold.
- Cap rate 3.7% vs local median 1.7% in Kimberling City — top-decile yield for the area; either an underpriced asset or a hidden risk that comps aren't pricing in. Stress-test before assuming the spread holds.
Questions for listing agent
- What do current leases actually rent for vs. the listed asking? Can we see a recent rent roll and the last 12 months of T-12 income?
- It's been on market 468 days. Have you received any prior offers? Is the seller open to a 40% concession, seller financing, or rate buy-down credit?
- Why hasn't it sold? Are there any deal-killer items the seller is aware of (foundation, flood, title, zoning, code violations)?
- Is there a deadline driving the sale (1031 exchange, divorce, estate, relocation)? That informs how much negotiation room exists.
- Schools are D-rated, which usually means shorter tenancies and higher turnover. Who's the typical renter profile here, and what's been the actual vacancy rate?
- The area grade is low — what's the realistic commute time and amenity access for the typical tenant pool here? Any planned neighborhood developments (good or bad) we should know about?
- What's the average days-on-market for RENTAL listings here right now (not sales)? A rising rental-DOM trend means longer vacancies and softer asking-rent achievability than the comps imply.
- What's the recent tenant-quality profile in this submarket — average credit score on applications, eviction rate, late-payment / NSF rate, and stable-employment percentage? A property-management company in the area should have these aggregated.
CashFlowRE · CFR-5J5BJD6K9SSKD7
· Data 6 days ago
cashflowre.app · 2026-05-29