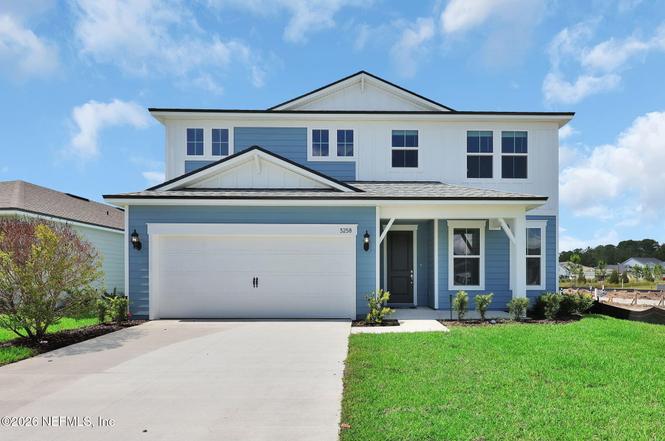
3258 Pipers Way
Asbury Lake, FL 32043
$389,000F
5 bd · 3.0 ba ·
2,266 sqft ·
Built 2026
· Land
· Pending
· 106 DOM
Cashflow @ list (25.0% down · 7.5%)
Estimated rent
$2,604/mo
Mortgage (P&I)
−$2,040
Tax + insurance
−$443
HOA
−$12
Vac / Maint / Mgmt
−$547
Net cashflow
$-438/mo
Annual
$-5,255/yr
Cap rate
4.94%
Cash-on-cash
-4.82%
DSCR
0.79
1% rule
0.67%
Cash to close
$108,920
Investor read
- This is a 5-bed/3.0-bath land listed at $389k.
- At list price, monthly cash flow is $-438 ($-5k/yr) — negative.
- To cash-flow at today's rent, offer at most $312k (19.9% below list).
- To meet the 1% rule (rent ≥ 1% of price), the offer needs to be $260k (33.1% below list).
- It's been on market 106 days — a 9% lower offer ($354k) is reasonable based on typical stale-listing flexibility.
- Recommended offer: $260k (33.1% below list) — sets the bar for 1% rule.
- Local home prices are declining (-3.0%/yr); year-one equity from $3k of loan paydown is wiped out by about $12k of value loss. Plan a longer hold.
- Location reads 61/100 on livability (#776 in FL) — a middle-class / working-renter tenant base. Strengths: housing A+, employment A, crime A-; Watch: schools F, amenities F, commute F.
- Clay (suburban): math 58% / reading 59% proficiency, ranked #14 of 73 in FL (top 19%) — acceptable for families but not a draw, mixed tenant base, ~2y average lease.
- Market conditions: Rents flat; 885 active listings in the ZIP; 5 comparable units currently listed for rent nearby; rentals leasing fast (median 4d on market — plan ~1-2 weeks tenant-placement turnaround); solid renter incomes; 1,876 units permitted in Clay County in 2024 (14 in 5+ unit buildings).
- Clay County population projected at +19% by 2050 — long-run rental-demand tailwind backs the buy-and-hold thesis.
- 2 sale attempts with the ask held roughly flat each time — persistent listings suggest the price (not the market) is what's stuck; bring a comps-based counter.
- This rent runs 37% of the median local income ($84k/yr) — at the standard rent-burdened threshold; future hikes will face affordability resistance.
Questions for listing agent
- What do current leases actually rent for vs. the listed asking? Can we see a recent rent roll and the last 12 months of T-12 income?
- It's been on market 106 days. Have you received any prior offers? Is the seller open to a 33% concession, seller financing, or rate buy-down credit?
- What does the HOA fee cover, when was the last increase, and are there any pending special assessments or reserve-fund shortfalls?
- Why hasn't it sold? Are there any deal-killer items the seller is aware of (foundation, flood, title, zoning, code violations)?
- Is there a deadline driving the sale (1031 exchange, divorce, estate, relocation)? That informs how much negotiation room exists.
- Schools are F-rated, which usually means shorter tenancies and higher turnover. Who's the typical renter profile here, and what's been the actual vacancy rate?
- The area grade is low — what's the realistic commute time and amenity access for the typical tenant pool here? Any planned neighborhood developments (good or bad) we should know about?
- What's the average days-on-market for RENTAL listings here right now (not sales)? A rising rental-DOM trend means longer vacancies and softer asking-rent achievability than the comps imply.
CashFlowRE · CFR-5JMQA42REQSRMM
· Data 6 days ago
cashflowre.app · 2026-05-29