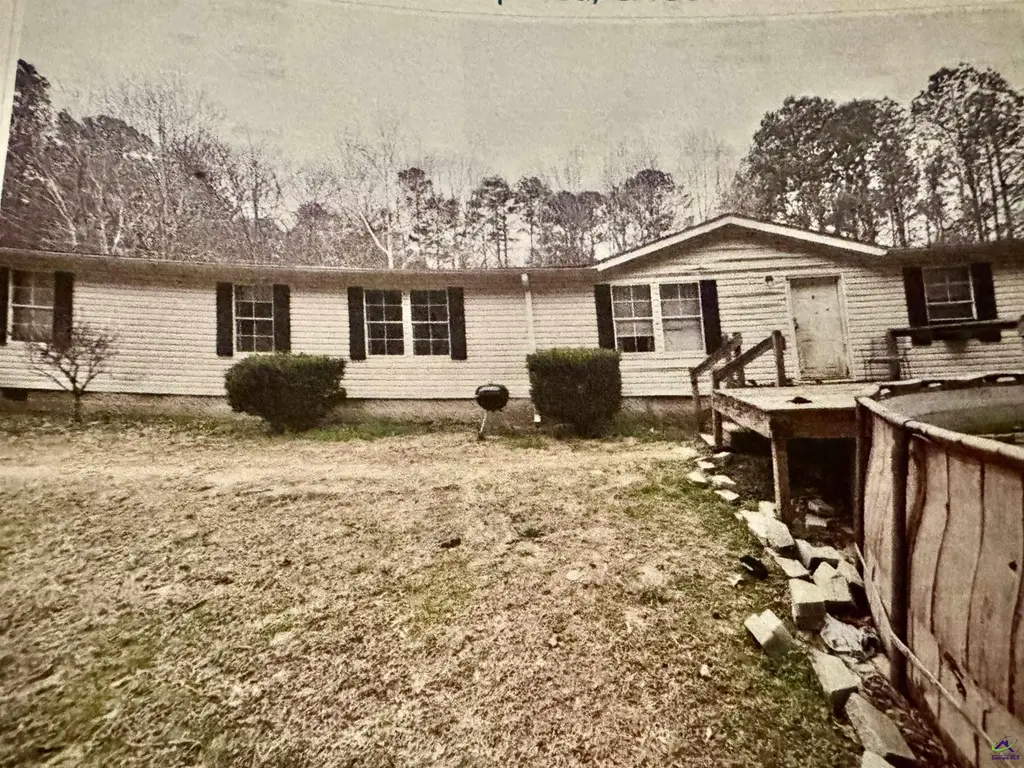
798 Williamson Rd
Tallapoosa, GA 30176
$200,000D
4 bd · 2.0 ba ·
2,128 sqft ·
Built 2003
· Manufactured
· Pending
Cashflow @ list (25.0% down · 7.5%)
Estimated rent
$1,579/mo
Mortgage (P&I)
−$1,049
Tax + insurance
−$248
HOA
−$0
Vac / Maint / Mgmt
−$332
Net cashflow
$-50/mo
Annual
$-594/yr
Cap rate
6.00%
Cash-on-cash
-1.06%
DSCR
0.95
1% rule
0.79%
Cash to close
$56,000
Investor read
- This is a 4-bed/2.0-bath manufactured listed at $200k.
- At list price, monthly cash flow is $-50 ($-594/yr) — negative.
- To cash-flow at today's rent, offer at most $191k (4.4% below list).
- To meet the 1% rule (rent ≥ 1% of price), the offer needs to be $158k (21.1% below list).
- Only 0 days on market — expect competitive offers; lowballing is unlikely to land.
- Recommended offer: $158k (21.1% below list) — sets the bar for 1% rule.
- In year one you build about $432 of equity ($1k loan paydown + $-951 appreciation (-0.5% local appreciation)).
- Location reads 70/100 on livability (#95 in GA) — a middle-class / working-renter tenant base. Strengths: cost of living A+, housing A+, health & safety A+; Watch: amenities F, commute F.
- Haralson County (rural): math 36% / reading 30% proficiency, ranked #76 of 174 in GA (top 44%) — families likely to look elsewhere, expect single-tenant / working-renter base with shorter leases.
- Zoned schools: West Haralson Elementary School (math 24% / reading 21%, grade F, #803 of 1,228 statewide, top 66%, 383 students, 85% FRL); Haralson County Middle School (math 43% / reading 33%, grade F, #159 of 470 statewide, top 34%, 772 students, 85% FRL); Haralson County High School (math 30% / reading 42%, grade F, #74 of 424 statewide, top 18%, 945 students, 85% FRL) — zoned schools average 85% FRL vs 54% district-wide (31 pts higher); higher-poverty schools than district average — tighter screening recommended.
- Market conditions: 72 active listings in the ZIP; 225 units permitted in Haralson County in 2024 (0 in 5+ unit buildings).
- Haralson County population projected to shrink 7% by 2050 — rents likely to lag national; underwrite the cash flow, not the appreciation.
- 3 sale attempts with the ask held roughly flat each time — persistent listings suggest the price (not the market) is what's stuck; bring a comps-based counter.
- Climate carrying-cost: major wildfire risk; extreme-heat days projected 7→19/yr by 2055 (HVAC capex compounding) — expect insurance premiums to compound above CPI over the hold.
- Cap rate 6.0% vs local median 3.0% in Tallapoosa — top-decile yield for the area; either an underpriced asset or a hidden risk that comps aren't pricing in. Stress-test before assuming the spread holds.
Questions for listing agent
- What do current leases actually rent for vs. the listed asking? Can we see a recent rent roll and the last 12 months of T-12 income?
- Is there a deadline driving the sale (1031 exchange, divorce, estate, relocation)? That informs how much negotiation room exists.
- Schools are F-rated, which usually means shorter tenancies and higher turnover. Who's the typical renter profile here, and what's been the actual vacancy rate?
- The area grade is low — what's the realistic commute time and amenity access for the typical tenant pool here? Any planned neighborhood developments (good or bad) we should know about?
- What's the average days-on-market for RENTAL listings here right now (not sales)? A rising rental-DOM trend means longer vacancies and softer asking-rent achievability than the comps imply.
- What's the recent tenant-quality profile in this submarket — average credit score on applications, eviction rate, late-payment / NSF rate, and stable-employment percentage? A property-management company in the area should have these aggregated.
- How much new for-sale + rental construction is in the pipeline within 1–3 miles? Heavy new supply typically softens prices + rents 12–24 months out; constrained supply supports both.
CashFlowRE · CFR-5RWM0HBNB6H2AZ
· Data 4 weeks ago
cashflowre.app · 2026-05-29