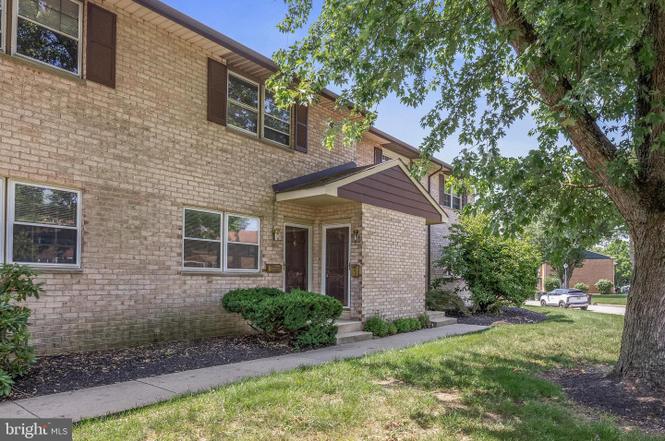
109 Eaves Mill Rd
Medford Lakes, NJ 08055
$145,000C
1 bd · 1.0 ba ·
868 sqft ·
Built 1970
· Townhouse
· Active
· 8 DOM
Cashflow @ list (25.0% down · 7.5%)
Estimated rent
$1,764/mo
Mortgage (P&I)
−$760
Tax + insurance
−$242
HOA
−$279
Vac / Maint / Mgmt
−$370
Net cashflow
$112/mo
Annual
$1,350/yr
Cap rate
7.22%
Cash-on-cash
3.32%
DSCR
1.15
1% rule
1.22%
Cash to close
$40,600
Investor read
- This is a 1-bed/1.0-bath townhouse listed at $145k.
- At list price, monthly cash flow is $112 ($1k/yr) — positive.
- The deal already cash-flows at list — no discount required.
- Meets the 1% rule at list price ($2k rent vs $145k).
- Only 8 days on market — expect competitive offers; lowballing is unlikely to land.
- Local home prices are declining (-3.0%/yr); year-one equity from $1k of loan paydown is wiped out by about $4k of value loss. Plan a longer hold.
- Location reads 66/100 on livability (#348 in NJ) — a middle-class / working-renter tenant base. Strengths: crime A+, employment A+, housing A+; Watch: amenities F, commute F, cost of living F.
- Medford Township School District (suburban): math 48% / reading 64% proficiency, ranked #65 of 472 in NJ (top 14%) — acceptable for families but not a draw, mixed tenant base, ~2y average lease; only 4% free/reduced lunch — higher-income household profile.
- Zoned schools: Milton H. Allen Elementary School (math 42% / reading 62%, grade C-, #209 of 1,303 statewide, top 19%, 377 students, 4% FRL) — zoned schools at 4% FRL track the district average.
- Market conditions: 178 active listings in the ZIP; 3 comparable units currently listed for rent nearby; rentals leasing fast (median 2d on market — plan ~1-2 weeks tenant-placement turnaround); 2,161 units permitted in Burlington County in 2024 (988 in 5+ unit buildings).
- Burlington County population projected to shrink 5% by 2050 — rents likely to lag national; underwrite the cash flow, not the appreciation.
- Climate carrying-cost: major wind risk, 61% chance of damaging wind over 30y; extreme-heat days projected 7→15/yr by 2055 (HVAC capex compounding) — expect insurance premiums to compound above CPI over the hold.
- Cap rate 7.2% vs local median 2.0% in Medford Lakes — top-decile yield for the area; either an underpriced asset or a hidden risk that comps aren't pricing in. Stress-test before assuming the spread holds.
Questions for listing agent
- Built in 1970 — when were the roof, HVAC, electrical panel, plumbing, and water heater last replaced?
- What does the HOA fee cover, when was the last increase, and are there any pending special assessments or reserve-fund shortfalls?
- Is there a deadline driving the sale (1031 exchange, divorce, estate, relocation)? That informs how much negotiation room exists.
- Schools are A-rated — typically a magnet for longer-tenancy family renters. What's the average tenant stay here, and is there a school-zone premium baked into asking?
- What's the average days-on-market for RENTAL listings here right now (not sales)? A rising rental-DOM trend means longer vacancies and softer asking-rent achievability than the comps imply.
- What's the recent tenant-quality profile in this submarket — average credit score on applications, eviction rate, late-payment / NSF rate, and stable-employment percentage? A property-management company in the area should have these aggregated.
- How much new for-sale + rental construction is in the pipeline within 1–3 miles? Heavy new supply typically softens prices + rents 12–24 months out; constrained supply supports both.
CashFlowRE · CFR-5S2RQXC1MBMMZ5
· Data 2 days ago
cashflowre.app · 2026-05-29