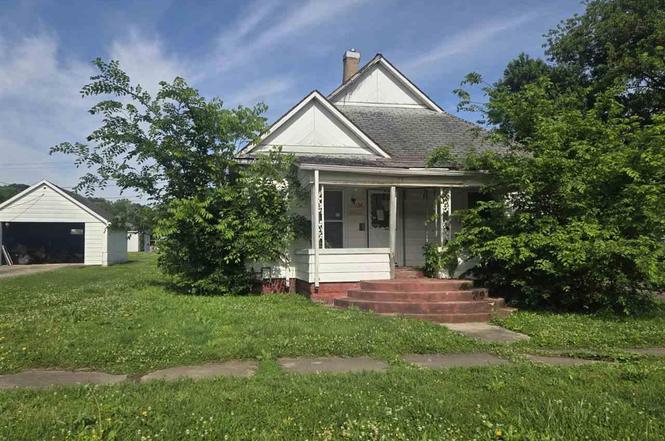
138 N 11th St
Clinton, IN 47842
$18,500D+
2 bd · 1.0 ba ·
1,043 sqft ·
Built 1912
· SingleFamily
· Active
· 4 DOM
Cashflow @ list (25.0% down · 7.5%)
Estimated rent
$957/mo
Mortgage (P&I)
−$97
Tax + insurance
−$54
HOA
−$0
Vac / Maint / Mgmt
−$201
Net cashflow
$605/mo
Annual
$7,262/yr
Cap rate
45.55%
Cash-on-cash
140.20%
DSCR
7.24
1% rule
5.17%
Cash to close
$5,180
Investor read
- This is a 2-bed/1.0-bath single-family listed at $18k.
- At list price, monthly cash flow is $605 ($7k/yr) — positive.
- The deal already cash-flows at list — no discount required.
- Meets the 1% rule at list price ($957 rent vs $18k).
- Only 4 days on market — expect competitive offers; lowballing is unlikely to land.
- In year one you build about $495 of equity ($128 loan paydown + $367 appreciation (2.0% local appreciation)).
- Location reads 62/100 on livability (#474 in IN) — a middle-class / working-renter tenant base. Strengths: cost of living A+, housing A+, crime B; Watch: amenities F, commute F, employment F.
- South Vermillion Community School Corporation (rural): math 31% / reading 42% proficiency, ranked #182 of 301 in IN (top 60%) — families likely to look elsewhere, expect single-tenant / working-renter base with shorter leases.
- Zoned schools: Central Elementary School (math 27% / reading 37%, grade F, #652 of 994 statewide, top 68%, 302 students, 64% FRL); South Vermillion High School (math 27% / reading 62%, grade F, #169 of 369 statewide, top 51%, 478 students, 54% FRL).
- Watch-outs: property tax is 3.0% of price; built in 1912 — expect roof / HVAC / electrical / plumbing capex.
- Market conditions: 48 active listings in the ZIP; 28 units permitted in Vermillion County in 2024 (0 in 5+ unit buildings).
- Vermillion County population projected at -22% by 2050 — secular population decline; favor cash flow + early exit over multi-decade hold.
- 3 sale attempts since 4y ago with the ask held roughly flat each time — persistent listings suggest the price (not the market) is what's stuck; bring a comps-based counter.
- At projected returns (2.0% appreciation + 3.0% rent growth), your $5k cash investment doubles in ~1 year — after that, you're playing with house money.
- Cap rate 45.5% vs local median 6.3% in Clinton — top-decile yield for the area; either an underpriced asset or a hidden risk that comps aren't pricing in. Stress-test before assuming the spread holds.
Questions for listing agent
- Built in 1912 — when were the roof, HVAC, electrical panel, plumbing, and water heater last replaced?
- Property tax is high relative to price — has the assessment been appealed recently, and will the sale trigger a re-assessment?
- Is there a deadline driving the sale (1031 exchange, divorce, estate, relocation)? That informs how much negotiation room exists.
- Schools are F-rated, which usually means shorter tenancies and higher turnover. Who's the typical renter profile here, and what's been the actual vacancy rate?
- The area grade is low — what's the realistic commute time and amenity access for the typical tenant pool here? Any planned neighborhood developments (good or bad) we should know about?
- What's the average days-on-market for RENTAL listings here right now (not sales)? A rising rental-DOM trend means longer vacancies and softer asking-rent achievability than the comps imply.
- What's the recent tenant-quality profile in this submarket — average credit score on applications, eviction rate, late-payment / NSF rate, and stable-employment percentage? A property-management company in the area should have these aggregated.
- How much new for-sale + rental construction is in the pipeline within 1–3 miles? Heavy new supply typically softens prices + rents 12–24 months out; constrained supply supports both.
CashFlowRE · CFR-5TY0SD2C8YNHEQ
· Data 2 h ago
cashflowre.app · 2026-05-29