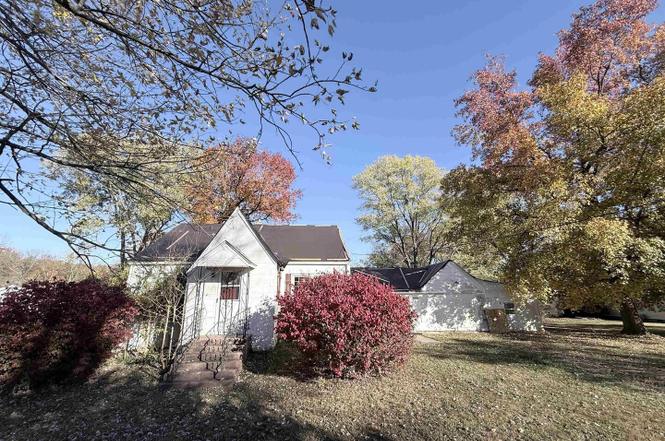
14322 Memory Ln
Mount Vernon, IL 62864
$30,000C
2 bd · 1.0 ba ·
1,000 sqft ·
Built 1930
· SingleFamily
· Pending
Cashflow @ list (25.0% down · 7.5%)
Estimated rent
$999/mo
Mortgage (P&I)
−$157
Tax + insurance
−$50
HOA
−$0
Vac / Maint / Mgmt
−$210
Net cashflow
$582/mo
Annual
$6,981/yr
Cap rate
29.56%
Cash-on-cash
83.11%
DSCR
4.70
1% rule
3.33%
Cash to close
$8,400
Investor read
- This is a 2-bed/1.0-bath single-family listed at $30k.
- At list price, monthly cash flow is $582 ($7k/yr) — positive.
- The deal already cash-flows at list — no discount required.
- Meets the 1% rule at list price ($999 rent vs $30k).
- Only 0 days on market — expect competitive offers; lowballing is unlikely to land.
- Local home prices are declining (-3.0%/yr); year-one equity from $207 of loan paydown is wiped out by about $900 of value loss. Plan a longer hold.
- Location reads 69/100 on livability (#413 in IL) — a middle-class / working-renter tenant base. Strengths: cost of living A+, housing A+, health & safety A+; Watch: amenities F, commute F, employment F.
- Mt Vernon Twp Hsd 201 (town): math 13% / reading 16% proficiency, ranked #532 of 620 in IL (top 86%) — low school quality limits family demand, transient renter base, plan for 1-2y turnover.
- Zoned schools: Summersville Grade School (math 37% / reading 42%, grade F, #392 of 2,056 statewide, top 21%, 275 students, 0% FRL); Mount Vernon High School (math 13% / reading 16%, grade F, #479 of 693 statewide, top 71%, 1,210 students, 0% FRL).
- Zoned-school proficiency averages 27% at this address vs 14% district-wide (+12 pts) — the actual schools serving this property are materially stronger than the Mt Vernon Twp Hsd 201 average implies; a family-tenant draw the district grade alone would hide.
- Watch-outs: built in 1930 — expect roof / HVAC / electrical / plumbing capex.
- Market conditions: 193 active listings in the ZIP; 6 units permitted in Jefferson County in 2024 (0 in 5+ unit buildings).
- Jefferson County population projected at -14% by 2050 — secular population decline; favor cash flow + early exit over multi-decade hold.
- 4 sale attempts since 2y ago with the ask held roughly flat each time — persistent listings suggest the price (not the market) is what's stuck; bring a comps-based counter.
- Current owner paid $20k; list at $30k implies a 50% gain — meaningful room to come down on a strong offer.
- At projected returns (-3.0% appreciation + 3.0% rent growth), your $8k cash investment doubles in ~2 years — after that, you're playing with house money.
- Cap rate 29.6% vs local median 5.2% in Mount Vernon — top-decile yield for the area; either an underpriced asset or a hidden risk that comps aren't pricing in. Stress-test before assuming the spread holds.
Questions for listing agent
- Built in 1930 — when were the roof, HVAC, electrical panel, plumbing, and water heater last replaced?
- Is there a deadline driving the sale (1031 exchange, divorce, estate, relocation)? That informs how much negotiation room exists.
- Schools are F-rated, which usually means shorter tenancies and higher turnover. Who's the typical renter profile here, and what's been the actual vacancy rate?
- What's the average days-on-market for RENTAL listings here right now (not sales)? A rising rental-DOM trend means longer vacancies and softer asking-rent achievability than the comps imply.
- What's the recent tenant-quality profile in this submarket — average credit score on applications, eviction rate, late-payment / NSF rate, and stable-employment percentage? A property-management company in the area should have these aggregated.
- How much new for-sale + rental construction is in the pipeline within 1–3 miles? Heavy new supply typically softens prices + rents 12–24 months out; constrained supply supports both.
CashFlowRE · CFR-60C7HF5TXA88T6
· Data 4 weeks ago
cashflowre.app · 2026-05-29