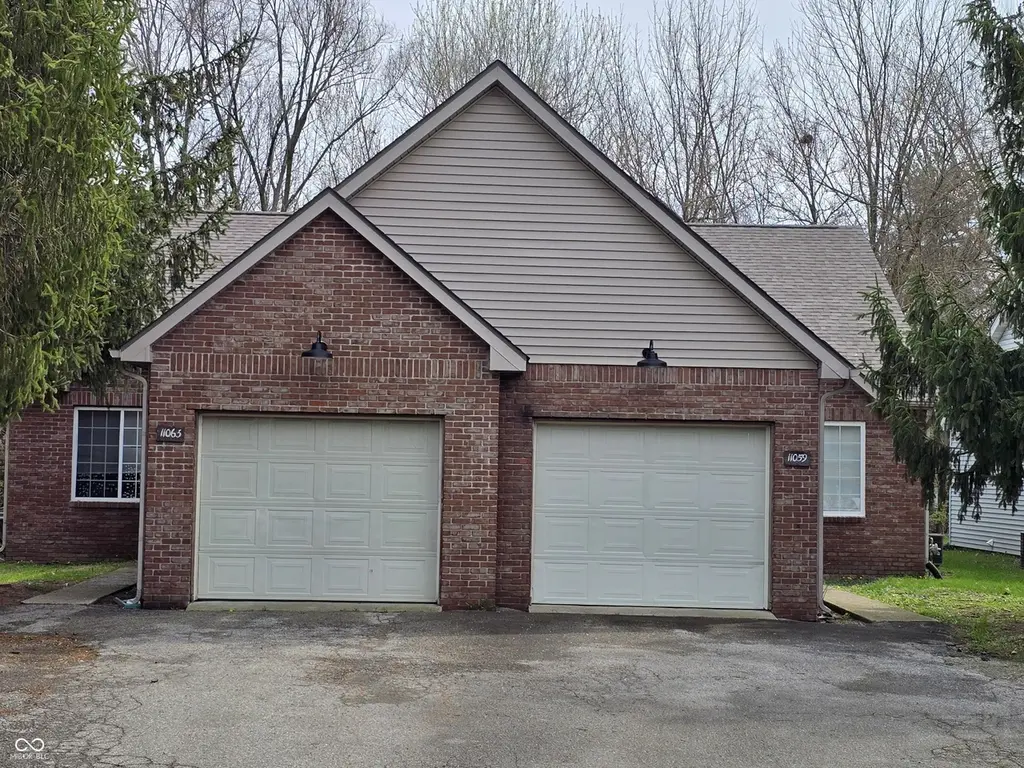
11059 Cornell Ave
Carmel, IN 46280
$429,900D
2 bd · 2.0 ba ·
2,010 sqft ·
Built 1993
· MultiFamily
· Pending
· 34 DOM
Cashflow @ list (25.0% down · 7.5%)
Estimated rent
$3,681/mo
Mortgage (P&I)
−$2,254
Tax + insurance
−$478
HOA
−$0
Vac / Maint / Mgmt
−$773
Net cashflow
$176/mo
Annual
$2,108/yr
Cap rate
6.78%
Cash-on-cash
1.75%
DSCR
1.08
1% rule
0.86%
Cash to close
$120,372
Investor read
- This is a 2-bed/2.0-bath multifamily listed at $430k.
- At list price, monthly cash flow is $176 ($2k/yr) — positive.
- The deal already cash-flows at list — no discount required.
- To meet the 1% rule (rent ≥ 1% of price), the offer needs to be $368k (14.4% below list).
- It's been on market 34 days — a 3% lower offer ($417k) is reasonable based on typical stale-listing flexibility.
- Recommended offer: $368k (14.4% below list) — sets the bar for 1% rule.
- Local home prices are declining (-3.0%/yr); year-one equity from $3k of loan paydown is wiped out by about $13k of value loss. Plan a longer hold.
- Location reads 84/100 on livability (#7 in IN, #726 nationally) — a professional / high-income tenant draw. Strengths: schools A+, crime A+, amenities A+; Watch: commute F.
- Carmel Clay Schools (urban): math 68% / reading 70% proficiency, ranked #1 of 301 in IN (top 0%) — acceptable for families but not a draw, mixed tenant base, ~2y average lease; only 7% free/reduced lunch — higher-income household profile.
- Market conditions: 50 active listings in the ZIP; 7 comparable units currently listed for rent nearby; rentals leasing fast (median 2d on market — plan ~1-2 weeks tenant-placement turnaround); solid renter incomes; 4,661 units permitted in Hamilton County in 2024 (1,528 in 5+ unit buildings).
- Hamilton County population projected at +44% by 2050 — long-run rental-demand tailwind backs the buy-and-hold thesis.
- 3 sale attempts since 25y ago with the ask held roughly flat each time — persistent listings suggest the price (not the market) is what's stuck; bring a comps-based counter.
- Current owner paid $163k; list at $430k implies a 163% gain — meaningful room to come down on a strong offer.
- Cap rate 6.8% vs local median 2.7% in Carmel — top-decile yield for the area; either an underpriced asset or a hidden risk that comps aren't pricing in. Stress-test before assuming the spread holds.
- At $3,681/mo this rent would consume 48% of the median local household income ($91k/yr) (locally 388% of renters already pay >50% of income on rent) — very limited rent-growth headroom before tenants either downsize or default.
Questions for listing agent
- It's been on market 34 days. Have you received any prior offers? Is the seller open to a 14% concession, seller financing, or rate buy-down credit?
- Is there a deadline driving the sale (1031 exchange, divorce, estate, relocation)? That informs how much negotiation room exists.
- Schools are A-rated — typically a magnet for longer-tenancy family renters. What's the average tenant stay here, and is there a school-zone premium baked into asking?
- The area grade is low — what's the realistic commute time and amenity access for the typical tenant pool here? Any planned neighborhood developments (good or bad) we should know about?
- What's the average days-on-market for RENTAL listings here right now (not sales)? A rising rental-DOM trend means longer vacancies and softer asking-rent achievability than the comps imply.
- What's the recent tenant-quality profile in this submarket — average credit score on applications, eviction rate, late-payment / NSF rate, and stable-employment percentage? A property-management company in the area should have these aggregated.
- How much new apartment / multifamily construction is in the pipeline within 1–3 miles? Heavy new supply (>2% of stock underway) typically softens rents 12–24 months out; light construction supports rent growth.
CashFlowRE · CFR-63ECW6CZB2B8EZ
· Data 3 weeks ago
cashflowre.app · 2026-05-29