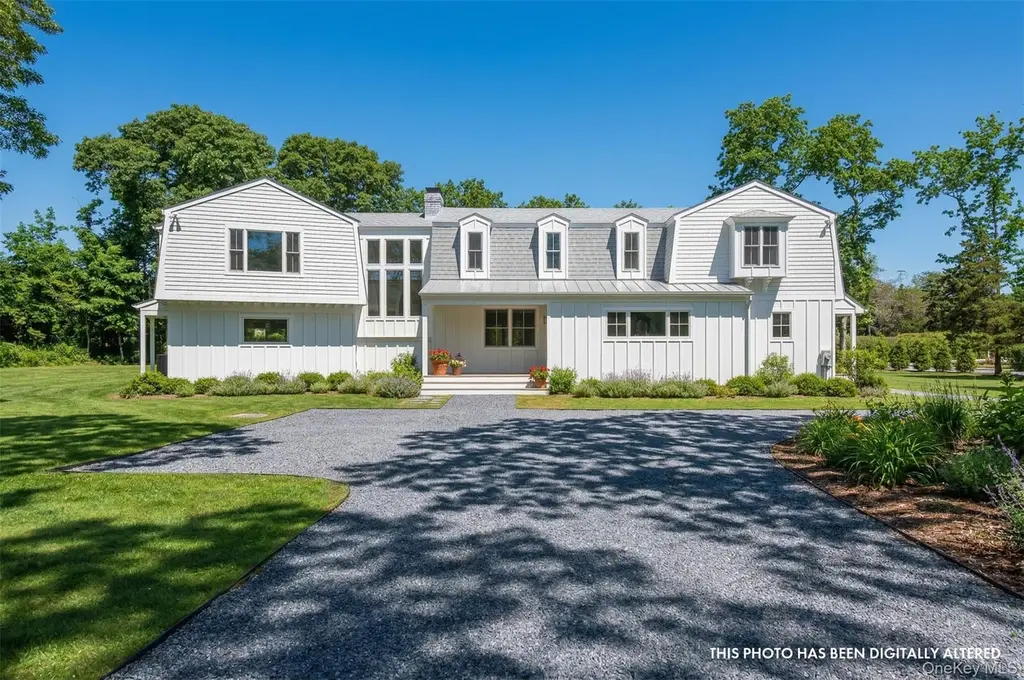
5 Pheasant Ln
Remsenburg-Speonk, NY 11960
$2,875,000D+
3 bd · 2.0 ba ·
3,878 sqft ·
Built 1975
· SingleFamily
· Active
· 198 DOM
Cashflow @ list (25.0% down · 7.5%)
Estimated rent
$18,871/mo
Mortgage (P&I)
−$15,077
Tax + insurance
−$1,874
HOA
−$0
Vac / Maint / Mgmt
−$3,963
Net cashflow
$-2,043/mo
Annual
$-24,519/yr
Cap rate
5.44%
Cash-on-cash
-3.05%
DSCR
0.86
1% rule
0.66%
Cash to close
$805,000
Investor read
- This is a 3-bed/2.0-bath single-family listed at $2.88M.
- At list price, monthly cash flow is $-2k ($-25k/yr) — negative.
- To cash-flow at today's rent, offer at most $2.51M (12.6% below list).
- To meet the 1% rule (rent ≥ 1% of price), the offer needs to be $1.89M (34.4% below list).
- It's been on market 198 days — a 12% lower offer ($2.53M) is reasonable based on typical stale-listing flexibility.
- Recommended offer: $1.89M (34.4% below list) — sets the bar for 1% rule.
- In year one you build about $244k of equity ($20k loan paydown + $225k appreciation (7.8% local appreciation)).
- Location reads: area grade D — affects rentability + tenant quality, not the cash-flow math above.
- Remsenburg-Speonk Union Free School District (suburban): math 60% / reading 40% proficiency, ranked #389 of 755 in NY (top 52%) — acceptable for families but not a draw, mixed tenant base, ~2y average lease; only 10% free/reduced lunch — higher-income household profile.
- Zoned schools: Remsenburg-Speonk Elementary School (math 52% / reading 62%, grade C+, #842 of 2,108 statewide, top 43%, 122 students, 36% FRL) — zoned schools average 36% FRL vs 10% district-wide (27 pts higher); higher-poverty schools than district average — tighter screening recommended.
- Market conditions: 41 active listings in the ZIP; 2 comparable units currently listed for rent nearby; 1,366 units permitted in Suffolk County in 2024 (216 in 5+ unit buildings).
- Suffolk County population projected to shrink 5% by 2050 — rents likely to lag national; underwrite the cash flow, not the appreciation.
- 5 sale attempts since 2y ago; this cycle's ask has dropped $225k (7%) from the opening price — seller is motivated, your offer sets the floor, not the list.
- Current owner paid $1.62M; list at $2.88M implies a 77% gain — meaningful room to come down on a strong offer.
- By year 2, paydown + projected appreciation supports a ~$391k cash-out refi (75% LTV) — recoverable capital for the next deal without selling this one.
- Climate carrying-cost: major flood risk; severe wind risk, 80% chance of damaging wind over 30y — expect insurance premiums to compound above CPI over the hold.
Questions for listing agent
- What do current leases actually rent for vs. the listed asking? Can we see a recent rent roll and the last 12 months of T-12 income?
- It's been on market 198 days. Have you received any prior offers? Is the seller open to a 34% concession, seller financing, or rate buy-down credit?
- Built in 1975 — when were the roof, HVAC, electrical panel, plumbing, and water heater last replaced?
- Why hasn't it sold? Are there any deal-killer items the seller is aware of (foundation, flood, title, zoning, code violations)?
- Is there a deadline driving the sale (1031 exchange, divorce, estate, relocation)? That informs how much negotiation room exists.
- The area grade is low — what's the realistic commute time and amenity access for the typical tenant pool here? Any planned neighborhood developments (good or bad) we should know about?
- What's the average days-on-market for RENTAL listings here right now (not sales)? A rising rental-DOM trend means longer vacancies and softer asking-rent achievability than the comps imply.
- What's the recent tenant-quality profile in this submarket — average credit score on applications, eviction rate, late-payment / NSF rate, and stable-employment percentage? A property-management company in the area should have these aggregated.
CashFlowRE · CFR-6558DE1VJ7SGMW
· Data 4 days ago
cashflowre.app · 2026-05-29