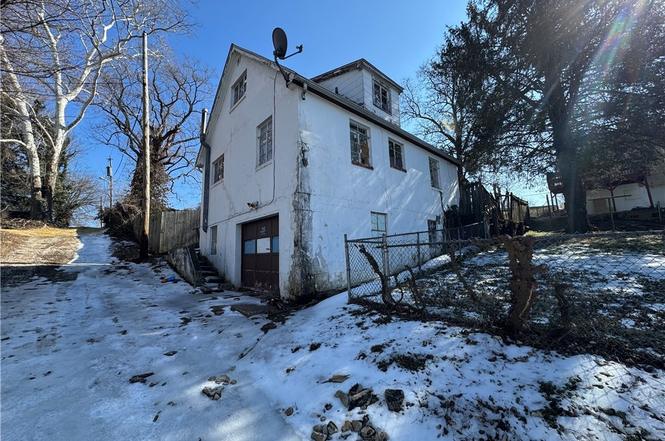
1902 Enslow Ave
Huntington, WV 25701
$40,000B
3 bd · 2.0 ba ·
1,608 sqft ·
Built 1948
· SingleFamily
· Active
· 104 DOM
Cashflow @ list (25.0% down · 7.5%)
Estimated rent
$1,359/mo
Mortgage (P&I)
−$210
Tax + insurance
−$68
HOA
−$0
Vac / Maint / Mgmt
−$285
Net cashflow
$796/mo
Annual
$9,546/yr
Cap rate
30.16%
Cash-on-cash
85.24%
DSCR
4.79
1% rule
3.40%
Cash to close
$11,200
Investor read
- This is a 3-bed/2.0-bath single-family listed at $40k.
- At list price, monthly cash flow is $796 ($10k/yr) — positive.
- The deal already cash-flows at list — no discount required.
- Meets the 1% rule at list price ($1k rent vs $40k).
- It's been on market 104 days — a 9% lower offer ($36k) is reasonable based on typical stale-listing flexibility.
- Recommended offer: $36k (9.0% below list) — sets the bar for market timing.
- Local home prices are declining (-3.0%/yr); year-one equity from $277 of loan paydown is wiped out by about $1k of value loss. Plan a longer hold.
- Location reads 79/100 on livability (#16 in WV, #2,045 nationally) — a middle-class / working-renter tenant base. Strengths: amenities A+, commute A+, cost of living A+; Watch: crime F, employment F.
- Cabell County Schools (urban): math 31% / reading 42% proficiency, ranked #13 of 55 in WV (top 24%) — families likely to look elsewhere, expect single-tenant / working-renter base with shorter leases.
- Zoned schools: Meadows Elementary School (math 32% / reading 42%, grade F, #130 of 377 statewide, top 39%, 250 students, 0% FRL); Huntington Middle School (math 21% / reading 35%, grade F, #66 of 109 statewide, top 63%, 647 students, 0% FRL); Huntington High School (math 26% / reading 50%, grade F, #31 of 110 statewide, top 28%, 1,704 students, 0% FRL) — zoned schools average 0% FRL vs 47% district-wide (47 pts lower); this property's tenant base skews higher-income than the district average.
- Watch-outs: built in 1948 — expect roof / HVAC / electrical / plumbing capex.
- Market conditions: Rents rising fast (+10.6%/yr); 127 active listings in the ZIP; 61 units permitted in Cabell County in 2024 (5 in 5+ unit buildings).
- 2 sale attempts with the ask held roughly flat each time — persistent listings suggest the price (not the market) is what's stuck; bring a comps-based counter.
- At projected returns (-3.0% appreciation + 8.0% rent growth), your $11k cash investment doubles in ~2 years — after that, you're playing with house money.
- Cap rate 30.2% vs local median 6.5% in Huntington — top-decile yield for the area; either an underpriced asset or a hidden risk that comps aren't pricing in. Stress-test before assuming the spread holds.
Questions for listing agent
- It's been on market 104 days. Have you received any prior offers? Is the seller open to a 9% concession, seller financing, or rate buy-down credit?
- Built in 1948 — when were the roof, HVAC, electrical panel, plumbing, and water heater last replaced?
- Why hasn't it sold? Are there any deal-killer items the seller is aware of (foundation, flood, title, zoning, code violations)?
- Is there a deadline driving the sale (1031 exchange, divorce, estate, relocation)? That informs how much negotiation room exists.
- Crime grade is F in this area — have there been break-ins, vandalism, or insurance claims at this property in the last 3 years? What carrier currently insures it and at what premium?
- What's the average days-on-market for RENTAL listings here right now (not sales)? A rising rental-DOM trend means longer vacancies and softer asking-rent achievability than the comps imply.
- What's the recent tenant-quality profile in this submarket — average credit score on applications, eviction rate, late-payment / NSF rate, and stable-employment percentage? A property-management company in the area should have these aggregated.
- How much new for-sale + rental construction is in the pipeline within 1–3 miles? Heavy new supply typically softens prices + rents 12–24 months out; constrained supply supports both.
CashFlowRE · CFR-65GPRT0NEKPMGA
· Data 1 day ago
cashflowre.app · 2026-05-29