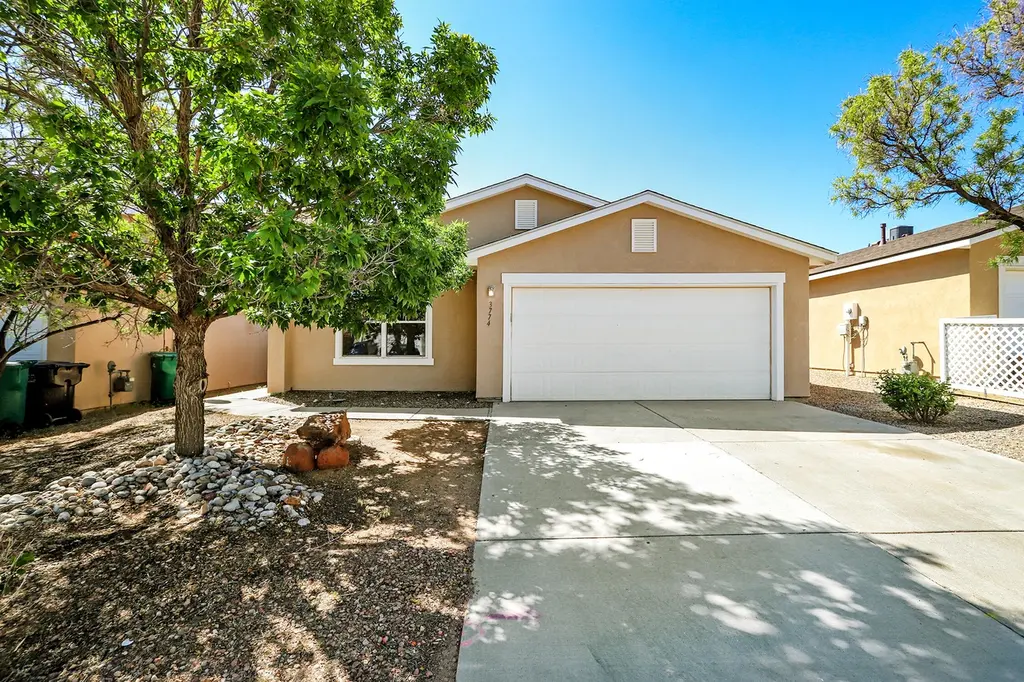
3774 Cattle Dr NE
Rio Rancho, NM 87144
$314,900D
4 bd · 2.0 ba ·
1,362 sqft ·
Built 2005
· SingleFamily
· Pending
· 32 DOM
Cashflow @ list (25.0% down · 7.5%)
Estimated rent
$2,346/mo
Mortgage (P&I)
−$1,651
Tax + insurance
−$269
HOA
−$0
Vac / Maint / Mgmt
−$493
Net cashflow
$-67/mo
Annual
$-803/yr
Cap rate
6.04%
Cash-on-cash
-0.91%
DSCR
0.96
1% rule
0.74%
Cash to close
$88,172
Investor read
- This is a 4-bed/2.0-bath single-family listed at $315k.
- At list price, monthly cash flow is $-67 ($-803/yr) — negative.
- To cash-flow at today's rent, offer at most $303k (3.8% below list).
- To meet the 1% rule (rent ≥ 1% of price), the offer needs to be $235k (25.5% below list).
- It's been on market 32 days — a 3% lower offer ($305k) is reasonable based on typical stale-listing flexibility.
- Recommended offer: $235k (25.5% below list) — sets the bar for 1% rule.
- Local home prices are declining (-3.0%/yr); year-one equity from $2k of loan paydown is wiped out by about $9k of value loss. Plan a longer hold.
- Location reads 71/100 on livability (#17 in NM) — a middle-class / working-renter tenant base. Strengths: housing A+, cost of living A; Watch: amenities D, commute F.
- Rio Rancho Public Schools (suburban): math 48% / reading 73% proficiency, ranked #4 of 29 in NM (top 14%) — acceptable for families but not a draw, mixed tenant base, ~2y average lease.
- Zoned schools: Enchanted Hills Elementary (723 students, 15% FRL); Rio Rancho Middle School (1,143 students, 24% FRL); Cleveland High School (math 46% / reading 70%, grade C, #32 of 110 statewide, top 28%, 2,631 students, 18% FRL) — zoned schools average 19% FRL vs 36% district-wide (18 pts lower); this property's tenant base skews higher-income than the district average.
- Market conditions: Rents rising fast (+6.9%/yr); 1325 active listings in the ZIP; 3 comparable units currently listed for rent nearby; rentals at typical pace (median 26d on market — plan ~3-4 weeks tenant-placement turnaround); solid renter incomes; 1,278 units permitted in Sandoval County in 2024 (216 in 5+ unit buildings).
- Sandoval County population projected at +15% by 2050 — long-run rental-demand tailwind backs the buy-and-hold thesis.
- Cap rate 6.0% vs local median 3.6% in Rio Rancho — top-decile yield for the area; either an underpriced asset or a hidden risk that comps aren't pricing in. Stress-test before assuming the spread holds.
Questions for listing agent
- What do current leases actually rent for vs. the listed asking? Can we see a recent rent roll and the last 12 months of T-12 income?
- It's been on market 32 days. Have you received any prior offers? Is the seller open to a 26% concession, seller financing, or rate buy-down credit?
- Is there a deadline driving the sale (1031 exchange, divorce, estate, relocation)? That informs how much negotiation room exists.
- The area grade is low — what's the realistic commute time and amenity access for the typical tenant pool here? Any planned neighborhood developments (good or bad) we should know about?
- What's the average days-on-market for RENTAL listings here right now (not sales)? A rising rental-DOM trend means longer vacancies and softer asking-rent achievability than the comps imply.
- What's the recent tenant-quality profile in this submarket — average credit score on applications, eviction rate, late-payment / NSF rate, and stable-employment percentage? A property-management company in the area should have these aggregated.
- How much new for-sale + rental construction is in the pipeline within 1–3 miles? Heavy new supply typically softens prices + rents 12–24 months out; constrained supply supports both.
CashFlowRE · CFR-65VKWN993DAZP9
· Data 1 week ago
cashflowre.app · 2026-05-29