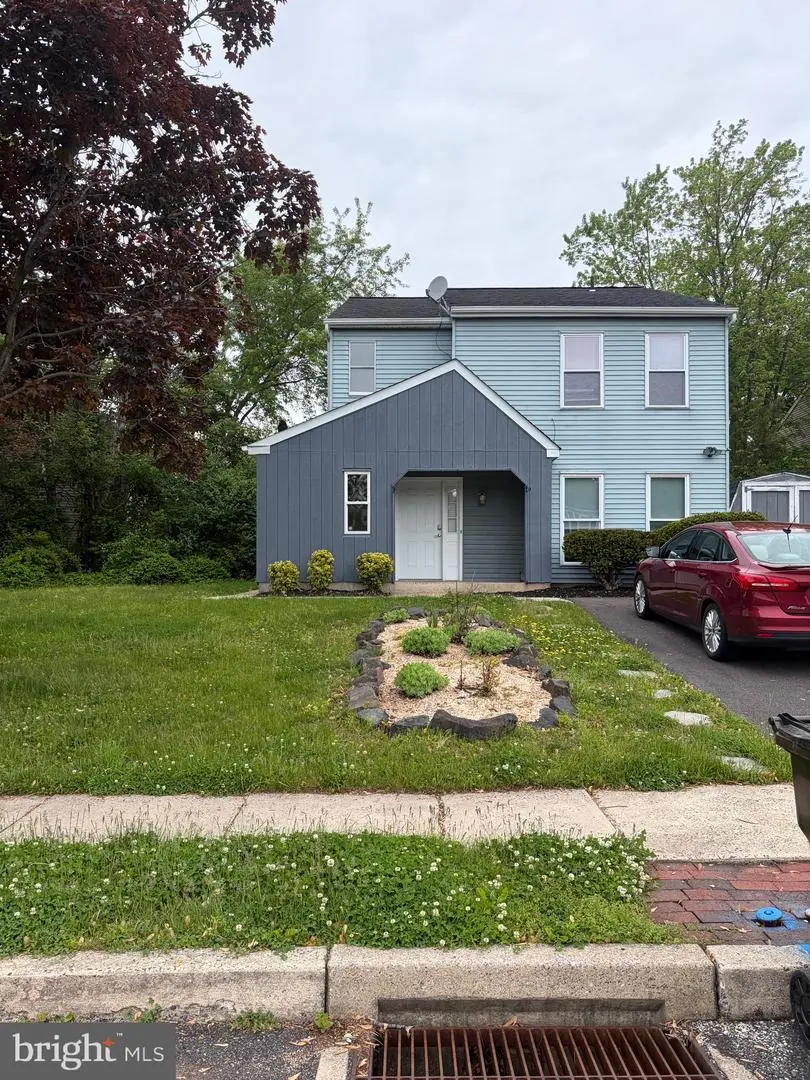
199 Michele Way
Harleysville, PA 19438
$484,990D
4 bd · 2.0 ba ·
1,968 sqft ·
Built 1984
· MultiFamily
· Pending
· 7 DOM
Cashflow @ list (25.0% down · 7.5%)
Estimated rent
$3,788/mo
Mortgage (P&I)
−$2,543
Tax + insurance
−$648
HOA
−$0
Vac / Maint / Mgmt
−$795
Net cashflow
$-198/mo
Annual
$-2,382/yr
Cap rate
5.80%
Cash-on-cash
-1.75%
DSCR
0.92
1% rule
0.78%
Cash to close
$135,797
Investor read
- This is a 2 × 2-bed/1-bath units multifamily listed at $485k.
- At list price, monthly cash flow is $-198 ($-2k/yr) — negative. Per door: $-99/mo.
- To cash-flow at today's rent, offer at most $450k (7.2% below list).
- To meet the 1% rule (rent ≥ 1% of price), the offer needs to be $379k (21.9% below list).
- Only 7 days on market — expect competitive offers; lowballing is unlikely to land.
- Recommended offer: $379k (21.9% below list) — sets the bar for 1% rule.
- Local home prices are declining (-3.0%/yr); year-one equity from $3k of loan paydown is wiped out by about $15k of value loss. Plan a longer hold.
- Location reads 79/100 on livability (#242 in PA, #2,073 nationally) — a middle-class / working-renter tenant base. Strengths: crime A+, employment A+, housing A+; Watch: cost of living D+, amenities F, commute F.
- Souderton Area SD (suburban): math 53% / reading 67% proficiency, ranked #59 of 539 in PA (top 11%) — acceptable for families but not a draw, mixed tenant base, ~2y average lease; only 16% free/reduced lunch — higher-income household profile.
- Market conditions: 93 active listings in the ZIP; 1 comparable units currently listed for rent nearby; high-income renter base; 1,936 units permitted in Montgomery County in 2024 (530 in 5+ unit buildings).
- Montgomery County population projected at +5% by 2050 — modest demand growth; plan on rents tracking national, not racing it.
- 5 sale attempts since 22y ago with the ask held roughly flat each time — persistent listings suggest the price (not the market) is what's stuck; bring a comps-based counter.
- Current owner paid $245k; list at $485k implies a 98% gain — meaningful room to come down on a strong offer.
- Climate carrying-cost: major wind risk, 27% chance of damaging wind over 30y; extreme-heat days projected 7→15/yr by 2055 (HVAC capex compounding) — expect insurance premiums to compound above CPI over the hold.
- Cap rate 5.8% vs local median 2.5% in Harleysville — top-decile yield for the area; either an underpriced asset or a hidden risk that comps aren't pricing in. Stress-test before assuming the spread holds.
- This rent runs 33% of the median local income ($138k/yr) — at the standard rent-burdened threshold; future hikes will face affordability resistance.
Questions for listing agent
- What do current leases actually rent for vs. the listed asking? Can we see a recent rent roll and the last 12 months of T-12 income?
- Can we see the unit-by-unit rent roll, current vacancy, and any below-market leases? What's the average tenancy length?
- What capital expenditures (roof, boiler, parking lot, exteriors) have been made in the last 5 years, and what's planned in the next 2?
- Is there a deadline driving the sale (1031 exchange, divorce, estate, relocation)? That informs how much negotiation room exists.
- Schools are A-rated — typically a magnet for longer-tenancy family renters. What's the average tenant stay here, and is there a school-zone premium baked into asking?
- The area grade is low — what's the realistic commute time and amenity access for the typical tenant pool here? Any planned neighborhood developments (good or bad) we should know about?
- What's the average days-on-market for RENTAL listings here right now (not sales)? A rising rental-DOM trend means longer vacancies and softer asking-rent achievability than the comps imply.
- What's the recent tenant-quality profile in this submarket — average credit score on applications, eviction rate, late-payment / NSF rate, and stable-employment percentage? A property-management company in the area should have these aggregated.
CashFlowRE · CFR-660WH7071P045F
· Data 3 weeks ago
cashflowre.app · 2026-05-29