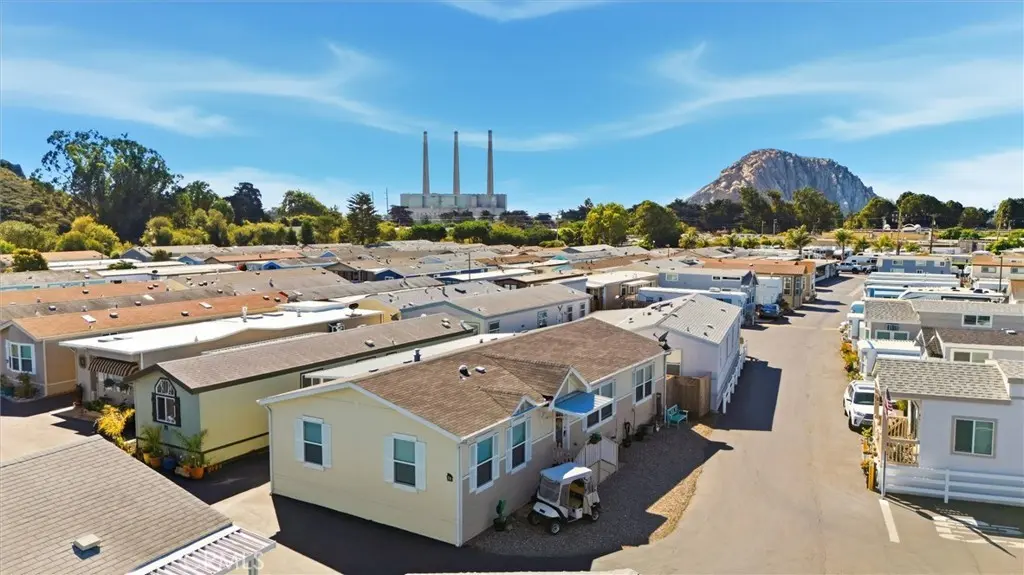
500 Atascadero Rd SPC F1
Morro Bay, CA 93442
$399,900C
3 bd · 2.0 ba ·
1,512 sqft ·
Built 2021
· Manufactured
· Active
· 236 DOM
Cashflow @ list (25.0% down · 7.5%)
Estimated rent
$3,653/mo
Mortgage (P&I)
−$2,097
Tax + insurance
−$346
HOA
−$0
Vac / Maint / Mgmt
−$767
Net cashflow
$443/mo
Annual
$5,319/yr
Cap rate
7.82%
Cash-on-cash
5.46%
DSCR
1.24
1% rule
0.91%
Cash to close
$111,972
Investor read
- This is a 3-bed/2.0-bath manufactured listed at $400k.
- At list price, monthly cash flow is $443 ($5k/yr) — positive.
- The deal already cash-flows at list — no discount required.
- To meet the 1% rule (rent ≥ 1% of price), the offer needs to be $365k (8.6% below list).
- It's been on market 236 days — a 12% lower offer ($352k) is reasonable based on typical stale-listing flexibility.
- Recommended offer: $352k (12.0% below list) — sets the bar for market timing.
- Local home prices are declining (-3.0%/yr); year-one equity from $3k of loan paydown is wiped out by about $12k of value loss. Plan a longer hold.
- Location reads 58/100 on livability (#726 in CA) — a working-class tenant base; expect higher turnover. Strengths: crime B, employment B; Watch: amenities F, commute F, cost of living F.
- San Luis Coastal Unified (urban): math 50% / reading 58% proficiency, ranked #118 of 517 in CA (top 23%) — acceptable for families but not a draw, mixed tenant base, ~2y average lease.
- Watch-outs: flood insurance adds $66/mo.
- Market conditions: Rents rising fast (+4.1%/yr); 59 active listings in the ZIP; 2 comparable units currently listed for rent nearby; solid renter incomes; 1,104 units permitted in San Luis Obispo County in 2024 (273 in 5+ unit buildings).
- San Luis Obispo County population projected at +20% by 2050 — long-run rental-demand tailwind backs the buy-and-hold thesis.
- Climate carrying-cost: major flood risk; extreme-heat days projected 7→16/yr by 2055 (HVAC capex compounding) — expect insurance premiums to compound above CPI over the hold.
- Cap rate 7.8% vs local median 1.8% in Morro Bay — top-decile yield for the area; either an underpriced asset or a hidden risk that comps aren't pricing in. Stress-test before assuming the spread holds.
- At $3,653/mo this rent would consume 46% of the median local household income ($96k/yr) (locally 333% of renters already pay >50% of income on rent) — very limited rent-growth headroom before tenants either downsize or default.
Questions for listing agent
- It's been on market 236 days. Have you received any prior offers? Is the seller open to a 12% concession, seller financing, or rate buy-down credit?
- What's the actual annual flood-insurance premium (NFIP or private), and is the property in a SFHA with mandatory coverage?
- Why hasn't it sold? Are there any deal-killer items the seller is aware of (foundation, flood, title, zoning, code violations)?
- Is there a deadline driving the sale (1031 exchange, divorce, estate, relocation)? That informs how much negotiation room exists.
- What's the average days-on-market for RENTAL listings here right now (not sales)? A rising rental-DOM trend means longer vacancies and softer asking-rent achievability than the comps imply.
- What's the recent tenant-quality profile in this submarket — average credit score on applications, eviction rate, late-payment / NSF rate, and stable-employment percentage? A property-management company in the area should have these aggregated.
- How much new for-sale + rental construction is in the pipeline within 1–3 miles? Heavy new supply typically softens prices + rents 12–24 months out; constrained supply supports both.
CashFlowRE · CFR-678RNWAN7XZ5HA
· Data 36 min ago
cashflowre.app · 2026-05-29