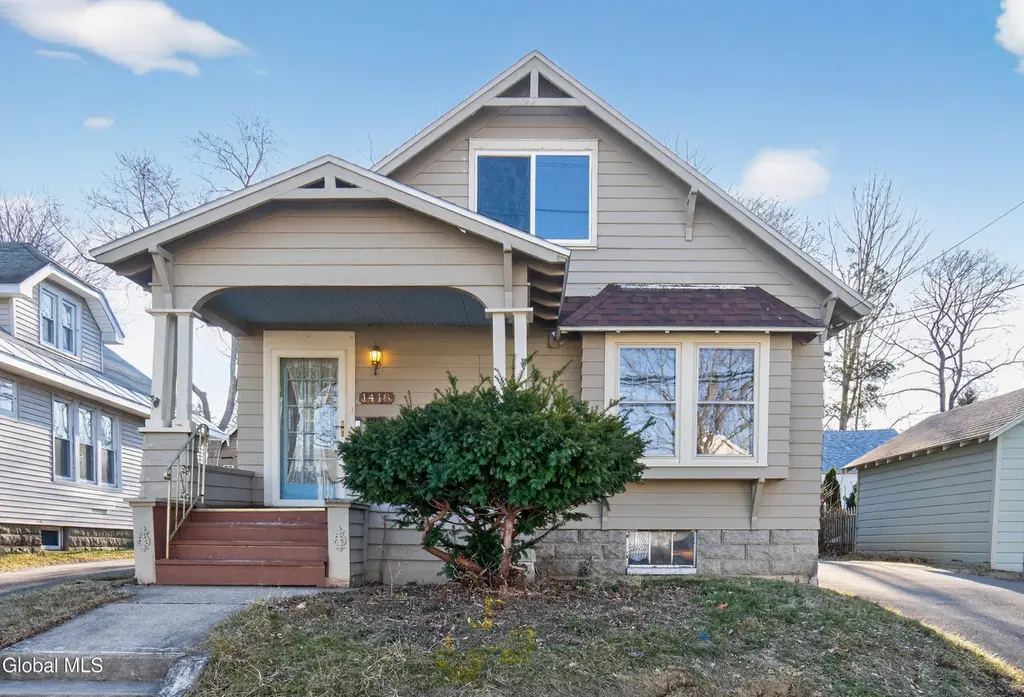
1418 Garner Ave
Schenectady, NY 12309
$265,000F
2 bd · 1.0 ba ·
1,424 sqft ·
Built 1920
· SingleFamily
· Active
· 89 DOM
Cashflow @ list (25.0% down · 7.5%)
Estimated rent
$1,704/mo
Mortgage (P&I)
−$1,390
Tax + insurance
−$658
HOA
−$0
Vac / Maint / Mgmt
−$358
Net cashflow
$-701/mo
Annual
$-8,410/yr
Cap rate
3.12%
Cash-on-cash
-11.33%
DSCR
0.50
1% rule
0.64%
Cash to close
$74,200
Investor read
- This is a 2-bed/1.0-bath single-family listed at $265k.
- At list price, monthly cash flow is $-701 ($-8k/yr) — negative.
- To cash-flow at today's rent, offer at most $141k (46.7% below list).
- To meet the 1% rule (rent ≥ 1% of price), the offer needs to be $170k (35.7% below list).
- It's been on market 89 days — a 6% lower offer ($249k) is reasonable based on typical stale-listing flexibility.
- Recommended offer: $141k (46.7% below list) — sets the bar for cash-flow.
- Local home prices are declining (-3.0%/yr); year-one equity from $2k of loan paydown is wiped out by about $8k of value loss. Plan a longer hold.
- Location reads 78/100 on livability (#167 in NY, #2,597 nationally) — a middle-class / working-renter tenant base. Strengths: commute A+, health & safety A+, cost of living A; Watch: schools C-, employment D+, crime F.
- Schenectady City School District (urban): math 38% / reading 34% proficiency, ranked #556 of 590 in NY (top 94%) — families likely to look elsewhere, expect single-tenant / working-renter base with shorter leases; 65% free/reduced lunch — lower-income household profile, screen leases tightly.
- Watch-outs: built in 1920 — expect roof / HVAC / electrical / plumbing capex.
- Market conditions: Rents soft (-1.6%/yr); 164 active listings in the ZIP; 16 comparable units currently listed for rent nearby; rentals at typical pace (median 20d on market — plan ~3-4 weeks tenant-placement turnaround); high-income renter base; 154 units permitted in Schenectady County in 2024 (54 in 5+ unit buildings).
- Schenectady County population projected to shrink 4% by 2050 — rents likely to lag national; underwrite the cash flow, not the appreciation.
- 6 sale attempts since 22y ago with the ask held roughly flat each time — persistent listings suggest the price (not the market) is what's stuck; bring a comps-based counter.
- Current owner paid $220k; 20% above their basis — modest negotiation headroom, anchor on the comps not their cost.
- Cap rate 3.1% vs local median 6.3% in Schenectady — below-typical yield; the buyer is paying a premium for something (appreciation thesis, condition, location) that the cap rate doesn't capture.
- This rent is only 16% of the median local income ($125k/yr) — well below the 30% rent-burden line; pricing power to push rent on renewal without tenant pushback.
Questions for listing agent
- What do current leases actually rent for vs. the listed asking? Can we see a recent rent roll and the last 12 months of T-12 income?
- It's been on market 89 days. Have you received any prior offers? Is the seller open to a 47% concession, seller financing, or rate buy-down credit?
- Built in 1920 — when were the roof, HVAC, electrical panel, plumbing, and water heater last replaced?
- Why hasn't it sold? Are there any deal-killer items the seller is aware of (foundation, flood, title, zoning, code violations)?
- Is there a deadline driving the sale (1031 exchange, divorce, estate, relocation)? That informs how much negotiation room exists.
- Crime grade is F in this area — have there been break-ins, vandalism, or insurance claims at this property in the last 3 years? What carrier currently insures it and at what premium?
- The area grade is low — what's the realistic commute time and amenity access for the typical tenant pool here? Any planned neighborhood developments (good or bad) we should know about?
- What's the average days-on-market for RENTAL listings here right now (not sales)? A rising rental-DOM trend means longer vacancies and softer asking-rent achievability than the comps imply.
CashFlowRE · CFR-68D7AKCWN3K7CP
· Data 2 days ago
cashflowre.app · 2026-05-29