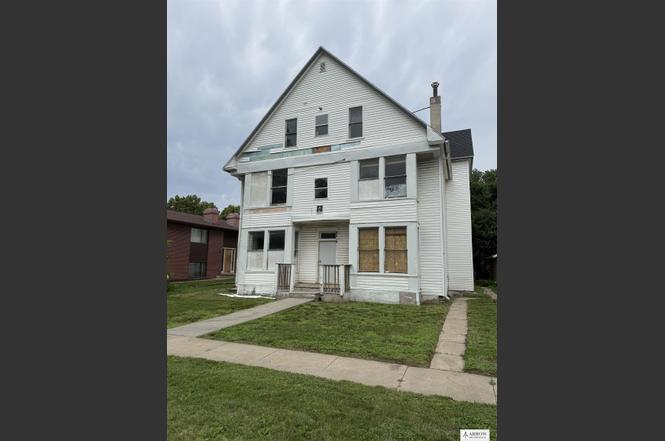
4526 Baldwin Ave
Lincoln, NE 68504
$129,900B-
9 bd · 5.0 ba ·
4,307 sqft ·
Built 1920
· Other
· Pending
· 4 DOM
Cashflow @ list (25.0% down · 7.5%)
Estimated rent
$1,819/mo
Mortgage (P&I)
−$681
Tax + insurance
−$341
HOA
−$0
Vac / Maint / Mgmt
−$382
Net cashflow
$415/mo
Annual
$4,977/yr
Cap rate
10.12%
Cash-on-cash
13.68%
DSCR
1.61
1% rule
1.40%
Cash to close
$36,372
Investor read
- This is a 9-bed/5.0-bath other listed at $130k.
- At list price, monthly cash flow is $415 ($5k/yr) — positive.
- The deal already cash-flows at list — no discount required.
- Meets the 1% rule at list price ($2k rent vs $130k).
- Only 4 days on market — expect competitive offers; lowballing is unlikely to land.
- Local home prices are declining (-3.0%/yr); year-one equity from $898 of loan paydown is wiped out by about $4k of value loss. Plan a longer hold.
- Location reads 85/100 on livability (#5 in NE, #545 nationally) — a professional / high-income tenant draw. Strengths: amenities A+, cost of living A+, housing A+; Watch: crime D+.
- Lincoln Public Schools (urban): math 50% / reading 53% proficiency, ranked #59 of 111 in NE (top 53%) — acceptable for families but not a draw, mixed tenant base, ~2y average lease.
- Zoned schools: Huntington Elementary School (math 22% / reading 32%, grade F, #438 of 502 statewide, top 88%, 372 students, 0% FRL); Dawes Middle School (math 32% / reading 38%, grade F, #103 of 128 statewide, top 80%, 405 students, 48% FRL); Lincoln Northeast High School (math 34% / reading 36%, grade F, #207 of 261 statewide, top 79%, 1,812 students, 62% FRL) — zoned schools at 37% FRL track the district average.
- Zoned-school proficiency averages 32% at this address vs 52% district-wide (-19 pts) — the specific schools serving this property underperform the Lincoln Public Schools average; the district grade overstates school quality for this exact location.
- Watch-outs: property tax is 2.7% of price; built in 1920 — expect roof / HVAC / electrical / plumbing capex.
- Market conditions: Rents flat; 60 active listings in the ZIP; 1,940 units permitted in Lancaster County in 2024 (895 in 5+ unit buildings).
- Lancaster County population projected at +37% by 2050 — long-run rental-demand tailwind backs the buy-and-hold thesis.
- Cap rate 10.1% vs local median 3.0% in Lincoln — top-decile yield for the area; either an underpriced asset or a hidden risk that comps aren't pricing in. Stress-test before assuming the spread holds.
- This rent runs 39% of the median local income ($56k/yr) — at the standard rent-burdened threshold; future hikes will face affordability resistance.
Questions for listing agent
- Built in 1920 — when were the roof, HVAC, electrical panel, plumbing, and water heater last replaced?
- Property tax is high relative to price — has the assessment been appealed recently, and will the sale trigger a re-assessment?
- Is there a deadline driving the sale (1031 exchange, divorce, estate, relocation)? That informs how much negotiation room exists.
- Schools are A-rated — typically a magnet for longer-tenancy family renters. What's the average tenant stay here, and is there a school-zone premium baked into asking?
- Crime grade is D in this area — have there been break-ins, vandalism, or insurance claims at this property in the last 3 years? What carrier currently insures it and at what premium?
- What's the average days-on-market for RENTAL listings here right now (not sales)? A rising rental-DOM trend means longer vacancies and softer asking-rent achievability than the comps imply.
- What's the recent tenant-quality profile in this submarket — average credit score on applications, eviction rate, late-payment / NSF rate, and stable-employment percentage? A property-management company in the area should have these aggregated.
- How much new for-sale + rental construction is in the pipeline within 1–3 miles? Heavy new supply typically softens prices + rents 12–24 months out; constrained supply supports both.
CashFlowRE · CFR-68D8XF20CTHSP2
· Data 5 days ago
cashflowre.app · 2026-05-29