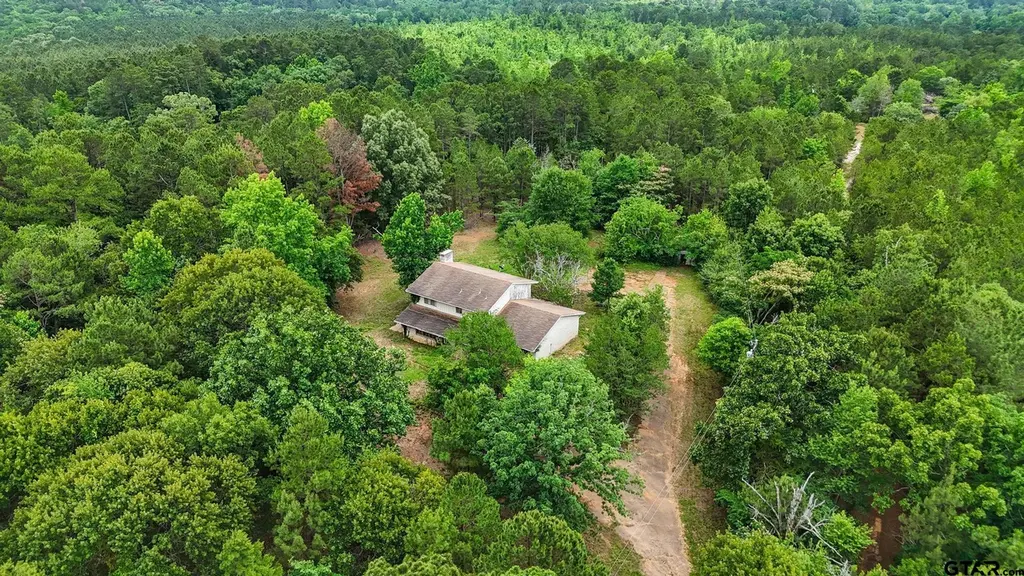
5782 Fm 346 E
Tyler, TX 75703
$215,000D
4 bd · 3.0 ba ·
2,168 sqft ·
Built 1974
· SingleFamily
· Pending
· 6 DOM
Cashflow @ list (25.0% down · 7.5%)
Estimated rent
$1,903/mo
Mortgage (P&I)
−$1,127
Tax + insurance
−$314
HOA
−$0
Vac / Maint / Mgmt
−$400
Net cashflow
$62/mo
Annual
$744/yr
Cap rate
6.64%
Cash-on-cash
1.24%
DSCR
1.05
1% rule
0.89%
Cash to close
$60,200
Investor read
- This is a 4-bed/3.0-bath single-family listed at $215k.
- At list price, monthly cash flow is $62 ($744/yr) — positive.
- The deal already cash-flows at list — no discount required.
- To meet the 1% rule (rent ≥ 1% of price), the offer needs to be $190k (11.5% below list).
- Only 6 days on market — expect competitive offers; lowballing is unlikely to land.
- Recommended offer: $190k (11.5% below list) — sets the bar for 1% rule.
- Local home prices are declining (-3.0%/yr); year-one equity from $1k of loan paydown is wiped out by about $6k of value loss. Plan a longer hold.
- Location reads 75/100 on livability (#147 in TX, #4,181 nationally) — a middle-class / working-renter tenant base. Strengths: cost of living A+, housing A+, health & safety A+; Watch: employment C-, crime D+, commute F.
- Whitehouse ISD (suburban): math 68% / reading 59% proficiency, ranked #38 of 826 in TX (top 5%) — acceptable for families but not a draw, mixed tenant base, ~2y average lease.
- Zoned schools: Stanton-Smith El (math 88% / reading 77%, grade A+, #20 of 4,322 statewide, top 0%, 515 students, 51% FRL); Whitehouse J H (math 65% / reading 53%, grade B, #181 of 1,662 statewide, top 11%, 776 students, 49% FRL); Whitehouse H S (math 71% / reading 69%, grade B+, #116 of 1,632 statewide, top 7%, 1,532 students, 44% FRL).
- Market conditions: Rents soft (-1.9%/yr); 655 active listings in the ZIP; solid renter incomes; 595 units permitted in Smith County in 2024 (45 in 5+ unit buildings).
- Smith County population projected at +24% by 2050 — long-run rental-demand tailwind backs the buy-and-hold thesis.
- Climate carrying-cost: major wind risk, 60% chance of damaging wind over 30y; moderate wildfire risk; extreme-heat days projected 7→24/yr by 2055 (HVAC capex compounding) — expect insurance premiums to compound above CPI over the hold.
- Cap rate 6.6% vs local median 3.5% in Tyler — top-decile yield for the area; either an underpriced asset or a hidden risk that comps aren't pricing in. Stress-test before assuming the spread holds.
Questions for listing agent
- Built in 1974 — when were the roof, HVAC, electrical panel, plumbing, and water heater last replaced?
- Is there a deadline driving the sale (1031 exchange, divorce, estate, relocation)? That informs how much negotiation room exists.
- Schools are D-rated, which usually means shorter tenancies and higher turnover. Who's the typical renter profile here, and what's been the actual vacancy rate?
- Crime grade is D in this area — have there been break-ins, vandalism, or insurance claims at this property in the last 3 years? What carrier currently insures it and at what premium?
- The area grade is low — what's the realistic commute time and amenity access for the typical tenant pool here? Any planned neighborhood developments (good or bad) we should know about?
- What's the average days-on-market for RENTAL listings here right now (not sales)? A rising rental-DOM trend means longer vacancies and softer asking-rent achievability than the comps imply.
- What's the recent tenant-quality profile in this submarket — average credit score on applications, eviction rate, late-payment / NSF rate, and stable-employment percentage? A property-management company in the area should have these aggregated.
- How much new for-sale + rental construction is in the pipeline within 1–3 miles? Heavy new supply typically softens prices + rents 12–24 months out; constrained supply supports both.
CashFlowRE · CFR-68FPEV9PM46MRC
· Data 3 weeks ago
cashflowre.app · 2026-05-29