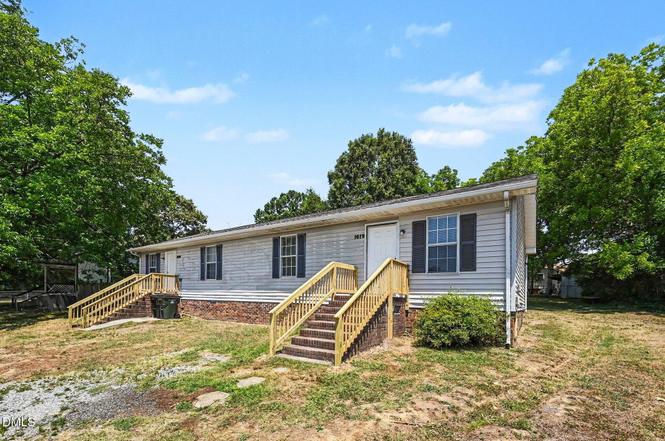
1019 Durham St
Burlington, NC 27217
$239,500C
4 bd · 2.0 ba ·
1,560 sqft ·
Built 1986
· MultiFamily
· Active
· 1 DOM
Cashflow @ list (25.0% down · 7.5%)
Estimated rent
$2,560/mo
Mortgage (P&I)
−$1,256
Tax + insurance
−$205
HOA
−$0
Vac / Maint / Mgmt
−$538
Net cashflow
$562/mo
Annual
$6,740/yr
Cap rate
9.11%
Cash-on-cash
10.05%
DSCR
1.45
1% rule
1.07%
Cash to close
$67,060
Investor read
- This is a 2 × 2-bed/1.0-bath units multifamily listed at $240k.
- At list price, monthly cash flow is $562 ($7k/yr) — positive. Per door: $281/mo.
- The deal already cash-flows at list — no discount required.
- Meets the 1% rule at list price ($3k rent vs $240k).
- Only 1 days on market — expect competitive offers; lowballing is unlikely to land.
- Local home prices are declining (-3.0%/yr); year-one equity from $2k of loan paydown is wiped out by about $7k of value loss. Plan a longer hold.
- Location reads 70/100 on livability (#123 in NC) — a middle-class / working-renter tenant base. Strengths: cost of living A+, housing A+, health & safety A+; Watch: commute D+, schools F, crime F.
- Alamance-Burlington Schools (rural): math 30% / reading 40% proficiency, ranked #133 of 178 in NC (top 75%) — families likely to look elsewhere, expect single-tenant / working-renter base with shorter leases.
- Market conditions: Rents rising (+1.1%/yr); 273 active listings in the ZIP; 4 comparable units currently listed for rent nearby; rentals leasing fast (median 13d on market — plan ~1-2 weeks tenant-placement turnaround); 2,466 units permitted in Alamance County in 2024 (403 in 5+ unit buildings).
- Alamance County population projected at +19% by 2050 — long-run rental-demand tailwind backs the buy-and-hold thesis.
- 4 sale attempts since 2y ago with the ask held roughly flat each time — persistent listings suggest the price (not the market) is what's stuck; bring a comps-based counter.
- Climate carrying-cost: moderate wind risk, 22% chance of damaging wind over 30y; extreme-heat days projected 7→18/yr by 2055 (HVAC capex compounding) — expect insurance premiums to compound above CPI over the hold.
- Cap rate 9.1% vs local median 3.6% in Burlington — top-decile yield for the area; either an underpriced asset or a hidden risk that comps aren't pricing in. Stress-test before assuming the spread holds.
- At $2,560/mo this rent would consume 59% of the median local household income ($52k/yr) (locally 1040% of renters already pay >50% of income on rent) — very limited rent-growth headroom before tenants either downsize or default.
Questions for listing agent
- Can we see the unit-by-unit rent roll, current vacancy, and any below-market leases? What's the average tenancy length?
- What capital expenditures (roof, boiler, parking lot, exteriors) have been made in the last 5 years, and what's planned in the next 2?
- Is there a deadline driving the sale (1031 exchange, divorce, estate, relocation)? That informs how much negotiation room exists.
- Schools are F-rated, which usually means shorter tenancies and higher turnover. Who's the typical renter profile here, and what's been the actual vacancy rate?
- Crime grade is F in this area — have there been break-ins, vandalism, or insurance claims at this property in the last 3 years? What carrier currently insures it and at what premium?
- What's the average days-on-market for RENTAL listings here right now (not sales)? A rising rental-DOM trend means longer vacancies and softer asking-rent achievability than the comps imply.
- What's the recent tenant-quality profile in this submarket — average credit score on applications, eviction rate, late-payment / NSF rate, and stable-employment percentage? A property-management company in the area should have these aggregated.
- How much new apartment / multifamily construction is in the pipeline within 1–3 miles? Heavy new supply (>2% of stock underway) typically softens rents 12–24 months out; light construction supports rent growth.
CashFlowRE · CFR-68MS70CCFRNJ1Y
· Data 1 day ago
cashflowre.app · 2026-05-29