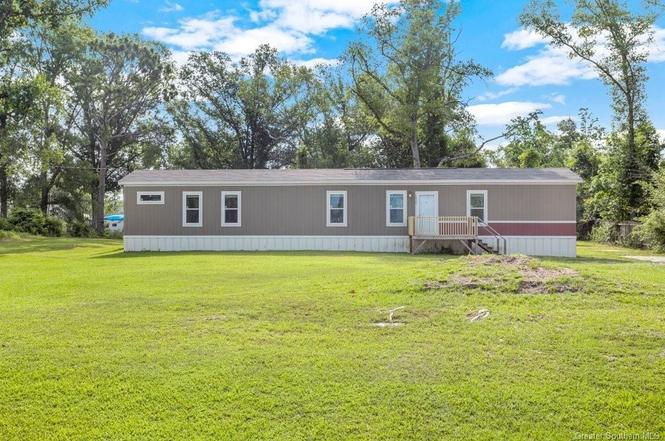
1412 Foxboro Dr
Moss Bluff, LA 70611
$129,900C-
3 bd · 2.0 ba ·
1,164 sqft ·
Built 2019
· Manufactured
· Active
· 2 DOM
Cashflow @ list (25.0% down · 7.5%)
Estimated rent
$1,249/mo
Mortgage (P&I)
−$681
Tax + insurance
−$125
HOA
−$0
Vac / Maint / Mgmt
−$262
Net cashflow
$180/mo
Annual
$2,159/yr
Cap rate
7.95%
Cash-on-cash
5.94%
DSCR
1.26
1% rule
0.96%
Cash to close
$36,372
Investor read
- This is a 3-bed/2.0-bath manufactured listed at $130k.
- At list price, monthly cash flow is $180 ($2k/yr) — positive.
- The deal already cash-flows at list — no discount required.
- To meet the 1% rule (rent ≥ 1% of price), the offer needs to be $125k (3.9% below list).
- Only 2 days on market — expect competitive offers; lowballing is unlikely to land.
- Recommended offer: $125k (3.9% below list) — sets the bar for 1% rule.
- Local home prices are declining (-3.0%/yr); year-one equity from $898 of loan paydown is wiped out by about $4k of value loss. Plan a longer hold.
- Location reads 72/100 on livability (#39 in LA) — a middle-class / working-renter tenant base. Strengths: cost of living A+, housing A+, employment A; Watch: amenities F, commute F.
- Calcasieu Parish (other): math 30% / reading 44% proficiency, ranked #29 of 98 in LA (top 30%) — families likely to look elsewhere, expect single-tenant / working-renter base with shorter leases.
- Zoned schools: Gillis Elementary School (math 35% / reading 40%, grade F, #247 of 646 statewide, top 39%, 691 students, 50% FRL); Moss Bluff Middle School (math 28% / reading 47%, grade F, #75 of 218 statewide, top 35%, 883 students, 41% FRL); Sam Houston High School (math 46% / reading 54%, grade D+, #36 of 265 statewide, top 13%, 1,216 students, 36% FRL).
- Market conditions: 322 active listings in the ZIP; 1 comparable units currently listed for rent nearby; solid renter incomes; 1,298 units permitted in Calcasieu Parish in 2024 (526 in 5+ unit buildings).
- Calcasieu County population projected at +11% by 2050 — modest demand growth; plan on rents tracking national, not racing it.
- Climate carrying-cost: severe wind risk, 99% chance of damaging wind over 30y; extreme-heat days projected 6→18/yr by 2055 (HVAC capex compounding) — expect insurance premiums to compound above CPI over the hold.
- Cap rate 8.0% vs local median 3.5% in Moss Bluff — top-decile yield for the area; either an underpriced asset or a hidden risk that comps aren't pricing in. Stress-test before assuming the spread holds.
- This rent is only 15% of the median local income ($102k/yr) — well below the 30% rent-burden line; pricing power to push rent on renewal without tenant pushback.
Questions for listing agent
- Is there a deadline driving the sale (1031 exchange, divorce, estate, relocation)? That informs how much negotiation room exists.
- Schools are D-rated, which usually means shorter tenancies and higher turnover. Who's the typical renter profile here, and what's been the actual vacancy rate?
- What's the average days-on-market for RENTAL listings here right now (not sales)? A rising rental-DOM trend means longer vacancies and softer asking-rent achievability than the comps imply.
- What's the recent tenant-quality profile in this submarket — average credit score on applications, eviction rate, late-payment / NSF rate, and stable-employment percentage? A property-management company in the area should have these aggregated.
- How much new for-sale + rental construction is in the pipeline within 1–3 miles? Heavy new supply typically softens prices + rents 12–24 months out; constrained supply supports both.
CashFlowRE · CFR-6DJ2DA8521B7NS
· Data 2 days ago
cashflowre.app · 2026-05-29