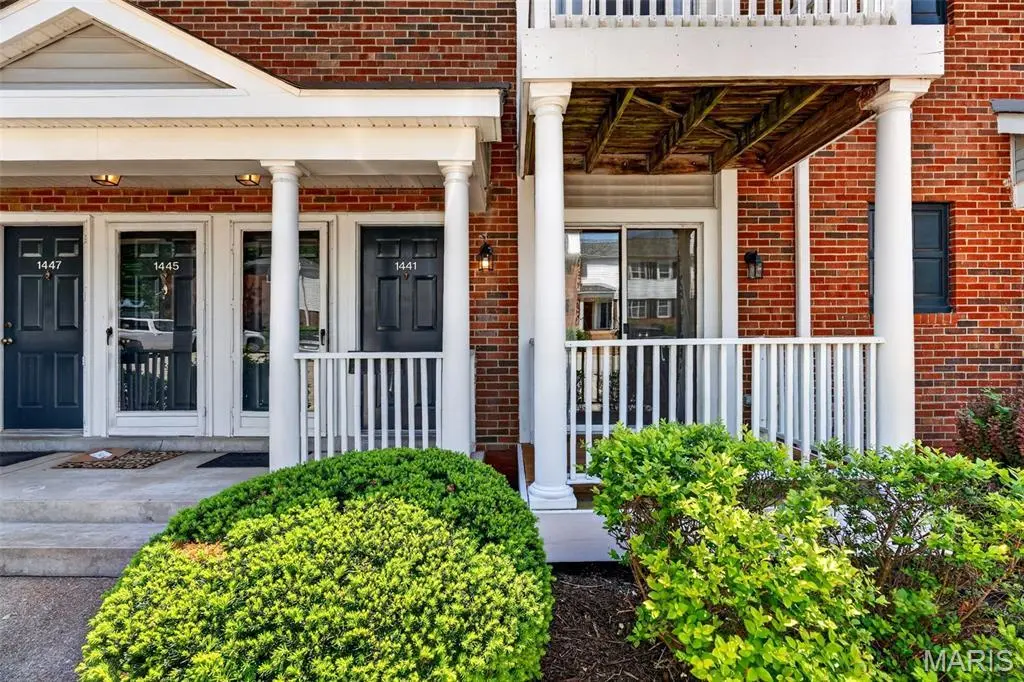
1441 Oriole Pl
Brentwood, MO 63144
$159,000C-
2 bd · 1.0 ba ·
918 sqft ·
Built 1950
· Condo
· Active
· 52 DOM
Cashflow @ list (25.0% down · 7.5%)
Estimated rent
$1,798/mo
Mortgage (P&I)
−$834
Tax + insurance
−$244
HOA
−$402
Vac / Maint / Mgmt
−$378
Net cashflow
$-59/mo
Annual
$-710/yr
Cap rate
5.85%
Cash-on-cash
-1.59%
DSCR
0.93
1% rule
1.13%
Cash to close
$44,520
Investor read
- This is a 2-bed/1.0-bath condo listed at $159k.
- At list price, monthly cash flow is $-59 ($-710/yr) — negative.
- To cash-flow at today's rent, offer at most $149k (6.6% below list).
- Meets the 1% rule at list price ($2k rent vs $159k).
- It's been on market 52 days — a 3% lower offer ($154k) is reasonable based on typical stale-listing flexibility.
- Recommended offer: $149k (6.6% below list) — sets the bar for cash-flow.
- Local home prices are declining (-3.0%/yr); year-one equity from $1k of loan paydown is wiped out by about $5k of value loss. Plan a longer hold.
- Location reads 84/100 on livability (#6 in MO, #689 nationally) — a professional / high-income tenant draw. Strengths: employment A+, housing A+, cost of living B; Watch: crime C-.
- Brentwood (suburban): math 65% / reading 66% proficiency, ranked #4 of 324 in MO (top 1%) — acceptable for families but not a draw, mixed tenant base, ~2y average lease; only 18% free/reduced lunch — higher-income household profile.
- Zoned schools: Mcgrath Elem. (math 67% / reading 67%, grade B+, #46 of 1,115 statewide, top 5%, 195 students, 16% FRL); Brentwood High (math 62% / reading 74%, grade B, #12 of 521 statewide, top 2%, 191 students, 30% FRL) — zoned schools at 23% FRL track the district average.
- Watch-outs: HOA is 22% of rent; built in 1950 — expect roof / HVAC / electrical / plumbing capex.
- Market conditions: Rents rising (+1.5%/yr); 128 active listings in the ZIP; 20 comparable units currently listed for rent nearby; rentals at typical pace (median 24d on market — plan ~3-4 weeks tenant-placement turnaround); 45% of comp listings sitting > 30 days — soft ceiling on asking rent; solid renter incomes; 920 units permitted in St. Louis County in 2024 (250 in 5+ unit buildings).
- 5 sale attempts since 11y ago with the ask held roughly flat each time — persistent listings suggest the price (not the market) is what's stuck; bring a comps-based counter.
- Current owner paid $120k; 32% above their basis — modest negotiation headroom, anchor on the comps not their cost.
- Climate carrying-cost: extreme-heat days projected 7→21/yr by 2055 (HVAC capex compounding) — expect insurance premiums to compound above CPI over the hold.
- Cap rate 5.8% vs local median 4.8% in Brentwood — meaningfully above typical; check what's discounted (condition, days-on-market, listing class) to confirm the premium yield is real.
Questions for listing agent
- What do current leases actually rent for vs. the listed asking? Can we see a recent rent roll and the last 12 months of T-12 income?
- It's been on market 52 days. Have you received any prior offers? Is the seller open to a 7% concession, seller financing, or rate buy-down credit?
- Built in 1950 — when were the roof, HVAC, electrical panel, plumbing, and water heater last replaced?
- What does the HOA fee cover, when was the last increase, and are there any pending special assessments or reserve-fund shortfalls?
- Any open or pending special assessments — roof, HVAC, plumbing, elevator, façade? What's the per-unit balance and payoff schedule, and is the seller paying it off at close or rolling it to the buyer?
- Is there a deadline driving the sale (1031 exchange, divorce, estate, relocation)? That informs how much negotiation room exists.
- Schools are A-rated — typically a magnet for longer-tenancy family renters. What's the average tenant stay here, and is there a school-zone premium baked into asking?
- What's the average days-on-market for RENTAL listings here right now (not sales)? A rising rental-DOM trend means longer vacancies and softer asking-rent achievability than the comps imply.
CashFlowRE · CFR-6DSRXD59T2R98M
· Data 2 days ago
cashflowre.app · 2026-05-29