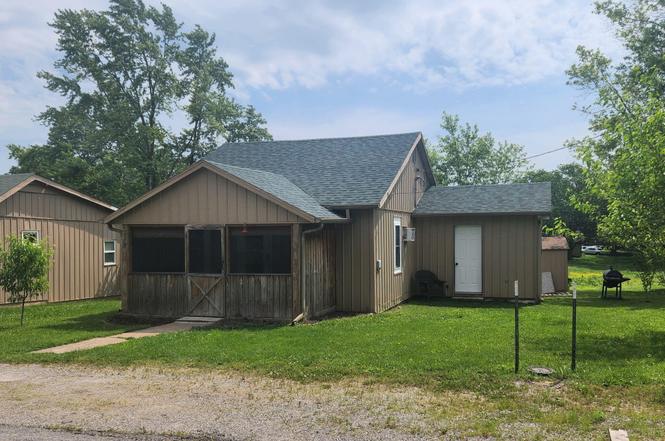
232 N Olive St
Niangua, MO 65713
$105,000C-
3 bd · 1.5 ba ·
788 sqft ·
Built 1948
· Other
· Active
· 284 DOM
Cashflow @ list (25.0% down · 7.5%)
Estimated rent
$952/mo
Mortgage (P&I)
−$551
Tax + insurance
−$175
HOA
−$0
Vac / Maint / Mgmt
−$200
Net cashflow
$27/mo
Annual
$322/yr
Cap rate
6.60%
Cash-on-cash
1.10%
DSCR
1.05
1% rule
0.91%
Cash to close
$29,400
Investor read
- This is a 3-bed/1.5-bath other listed at $105k.
- At list price, monthly cash flow is $27 ($322/yr) — positive.
- The deal already cash-flows at list — no discount required.
- To meet the 1% rule (rent ≥ 1% of price), the offer needs to be $95k (9.3% below list).
- It's been on market 284 days — a 12% lower offer ($92k) is reasonable based on typical stale-listing flexibility.
- Recommended offer: $92k (12.0% below list) — sets the bar for market timing.
- In year one you build about $11k of equity ($726 loan paydown + $10k appreciation (10.0% local appreciation)).
- Location reads 60/100 on livability (#487 in MO) — a middle-class / working-renter tenant base. Strengths: cost of living A+, housing A+; Watch: crime F, amenities F, commute F.
- Niangua R-V (rural): math 10% / reading 25% proficiency, ranked #518 of 535 in MO (top 97%) — low school quality limits family demand, transient renter base, plan for 1-2y turnover.
- Zoned schools: Niangua Elem. (math 12% / reading 22%, grade F, #967 of 1,115 statewide, top 88%, 152 students, 54% FRL); Niangua Middle School (math 12% / reading 17%, grade F, #362 of 391 statewide, top 93%, 63 students, 62% FRL); Niangua High (math 50% / reading 70%, grade C+, #35 of 521 statewide, top 8%, 80 students, 50% FRL) — zoned schools at 55% FRL track the district average.
- Zoned-school proficiency averages 30% at this address vs 18% district-wide (+13 pts) — the actual schools serving this property are materially stronger than the Niangua R-V average implies; a family-tenant draw the district grade alone would hide.
- Watch-outs: built in 1948 — expect roof / HVAC / electrical / plumbing capex.
- Market conditions: 11 active listings in the ZIP; 168 units permitted in Webster County in 2024 (24 in 5+ unit buildings).
- Webster County population projected at +5% by 2050 — modest demand growth; plan on rents tracking national, not racing it.
- 8 sale attempts since 10y ago with the ask held roughly flat each time — persistent listings suggest the price (not the market) is what's stuck; bring a comps-based counter.
- At projected returns (10.0% appreciation + 3.0% rent growth), your $29k cash investment doubles in ~3 years — after that, you're playing with house money.
- By year 4, paydown + projected appreciation supports a ~$40k cash-out refi (75% LTV) — recoverable capital for the next deal without selling this one.
Questions for listing agent
- It's been on market 284 days. Have you received any prior offers? Is the seller open to a 12% concession, seller financing, or rate buy-down credit?
- Built in 1948 — when were the roof, HVAC, electrical panel, plumbing, and water heater last replaced?
- Why hasn't it sold? Are there any deal-killer items the seller is aware of (foundation, flood, title, zoning, code violations)?
- Is there a deadline driving the sale (1031 exchange, divorce, estate, relocation)? That informs how much negotiation room exists.
- Schools are F-rated, which usually means shorter tenancies and higher turnover. Who's the typical renter profile here, and what's been the actual vacancy rate?
- Crime grade is F in this area — have there been break-ins, vandalism, or insurance claims at this property in the last 3 years? What carrier currently insures it and at what premium?
- What's the average days-on-market for RENTAL listings here right now (not sales)? A rising rental-DOM trend means longer vacancies and softer asking-rent achievability than the comps imply.
- What's the recent tenant-quality profile in this submarket — average credit score on applications, eviction rate, late-payment / NSF rate, and stable-employment percentage? A property-management company in the area should have these aggregated.
CashFlowRE · CFR-6K6J6R2Z8DCVRJ
· Data 6 h ago
cashflowre.app · 2026-05-29