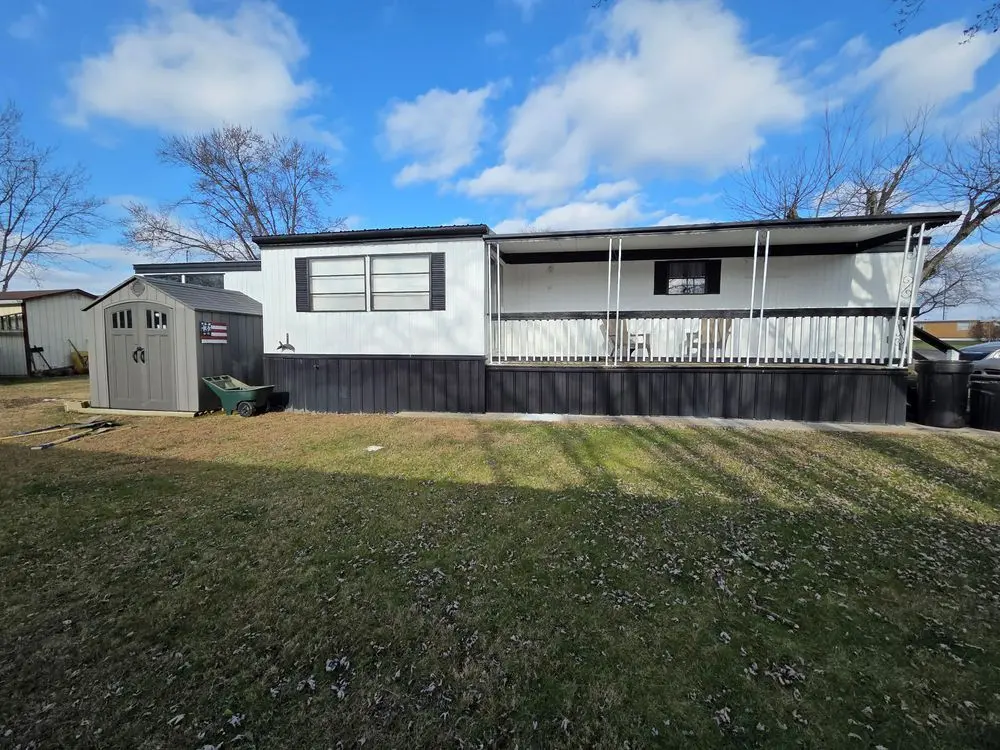
2870 Maysville Pike
South Zanesville, OH 43701
$39,900B+
2 bd · 1.5 ba ·
732 sqft ·
Built 1969
· Land
· Active
· 79 DOM
Cashflow @ list (25.0% down · 7.5%)
Estimated rent
$901/mo
Mortgage (P&I)
−$209
Tax + insurance
−$66
HOA
−$0
Vac / Maint / Mgmt
−$189
Net cashflow
$436/mo
Annual
$5,230/yr
Cap rate
19.40%
Cash-on-cash
46.82%
DSCR
3.08
1% rule
2.26%
Cash to close
$11,172
Investor read
- This is a 2-bed/1.5-bath land listed at $40k.
- At list price, monthly cash flow is $436 ($5k/yr) — positive.
- The deal already cash-flows at list — no discount required.
- Meets the 1% rule at list price ($901 rent vs $40k).
- It's been on market 79 days — a 6% lower offer ($38k) is reasonable based on typical stale-listing flexibility.
- Recommended offer: $38k (6.0% below list) — sets the bar for market timing.
- Local home prices are declining (-3.0%/yr); year-one equity from $276 of loan paydown is wiped out by about $1k of value loss. Plan a longer hold.
- Location reads 75/100 on livability (#242 in OH, #3,856 nationally) — a middle-class / working-renter tenant base. Strengths: crime A+, cost of living A+, health & safety A+; Watch: commute F, employment F.
- Maysville Local (town): math 46% / reading 56% proficiency, ranked #435 of 656 in OH (top 66%) — acceptable for families but not a draw, mixed tenant base, ~2y average lease.
- Zoned schools: Maysville Elementary School (math 61% / reading 64%, grade B, #580 of 1,584 statewide, top 37%, 807 students, 0% FRL); Maysville Middle School (math 35% / reading 46%, grade F, #509 of 654 statewide, top 78%, 479 students, 0% FRL); Maysville High School (math 32% / reading 62%, grade D-, #435 of 781 statewide, top 59%, 444 students, 0% FRL) — zoned schools average 0% FRL vs 46% district-wide (46 pts lower); this property's tenant base skews higher-income than the district average.
- Market conditions: Rents rising fast (+4.2%/yr); 300 active listings in the ZIP; 140 units permitted in Muskingum County in 2024 (100 in 5+ unit buildings).
- Muskingum County population projected at -10% by 2050 — secular population decline; favor cash flow + early exit over multi-decade hold.
- 13 sale attempts since 19y ago with the ask held roughly flat each time — persistent listings suggest the price (not the market) is what's stuck; bring a comps-based counter.
- Current owner paid $23k; list at $40k implies a 71% gain — meaningful room to come down on a strong offer.
- At projected returns (-3.0% appreciation + 4.2% rent growth), your $11k cash investment doubles in ~3 years — after that, you're playing with house money.
Questions for listing agent
- It's been on market 79 days. Have you received any prior offers? Is the seller open to a 6% concession, seller financing, or rate buy-down credit?
- Built in 1969 — when were the roof, HVAC, electrical panel, plumbing, and water heater last replaced?
- Why hasn't it sold? Are there any deal-killer items the seller is aware of (foundation, flood, title, zoning, code violations)?
- Is there a deadline driving the sale (1031 exchange, divorce, estate, relocation)? That informs how much negotiation room exists.
- Schools are F-rated, which usually means shorter tenancies and higher turnover. Who's the typical renter profile here, and what's been the actual vacancy rate?
- What's the average days-on-market for RENTAL listings here right now (not sales)? A rising rental-DOM trend means longer vacancies and softer asking-rent achievability than the comps imply.
- What's the recent tenant-quality profile in this submarket — average credit score on applications, eviction rate, late-payment / NSF rate, and stable-employment percentage? A property-management company in the area should have these aggregated.
- How much new for-sale + rental construction is in the pipeline within 1–3 miles? Heavy new supply typically softens prices + rents 12–24 months out; constrained supply supports both.
CashFlowRE · CFR-6KW3XR88K1MRT7
· Data 2 weeks ago
cashflowre.app · 2026-05-29