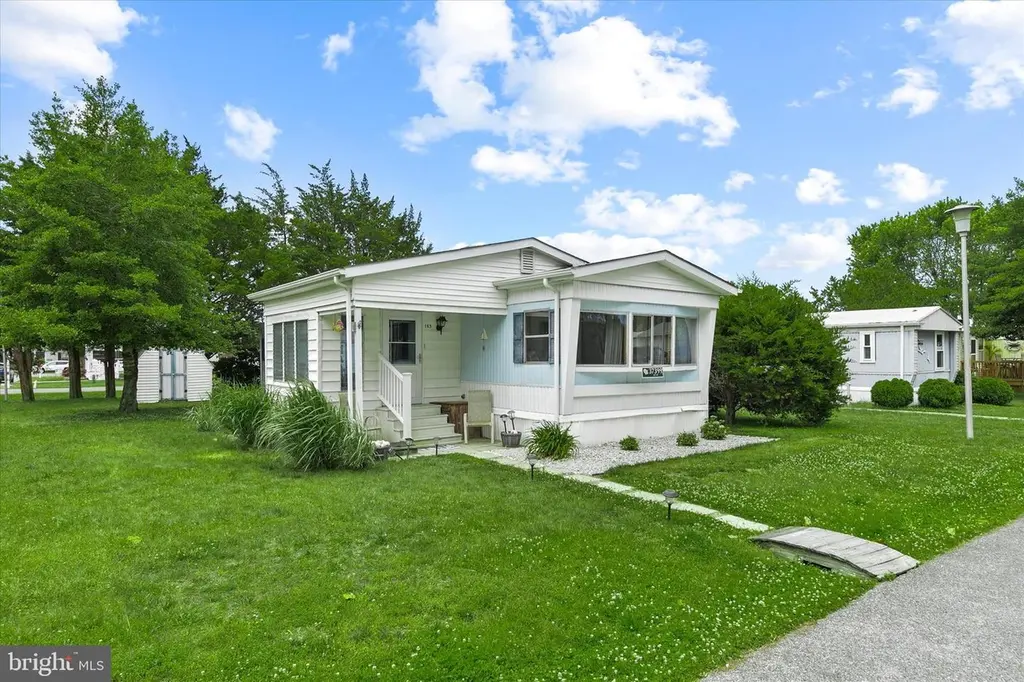
37399 Shady Way #17949
Ocean City, MD 19975
$125,000B
2 bd · 2.0 ba ·
980 sqft ·
Built 1982
· SingleFamily
· Active
· 7 DOM
Cashflow @ list (25.0% down · 7.5%)
Estimated rent
$2,000/mo
Mortgage (P&I)
−$656
Tax + insurance
−$208
HOA
−$0
Vac / Maint / Mgmt
−$420
Net cashflow
$716/mo
Annual
$8,594/yr
Cap rate
13.17%
Cash-on-cash
24.55%
DSCR
2.09
1% rule
1.60%
Cash to close
$35,000
Investor read
- This is a 2-bed/2.0-bath single-family listed at $125k.
- At list price, monthly cash flow is $716 ($9k/yr) — positive.
- The deal already cash-flows at list — no discount required.
- Meets the 1% rule at list price ($2k rent vs $125k).
- Only 7 days on market — expect competitive offers; lowballing is unlikely to land.
- Local home prices are declining (-3.0%/yr); year-one equity from $864 of loan paydown is wiped out by about $4k of value loss. Plan a longer hold.
- Location reads 73/100 on livability (#125 in MD) — a middle-class / working-renter tenant base. Strengths: commute A+, health & safety A+, amenities B; Watch: cost of living C-, crime F.
- Indian River School District (rural): math 25% / reading 41% proficiency, ranked #14 of 26 in DE (top 54%) — families likely to look elsewhere, expect single-tenant / working-renter base with shorter leases.
- Zoned schools: Showell (Phillip C.) Elementary School (math 27% / reading 37%, grade F, #44 of 105 statewide, top 46%, 279 students, 0% FRL); Selbyville Middle School (math 20% / reading 49%, grade F, #12 of 36 statewide, top 34%, 719 students, 0% FRL); Indian River High School (math 32% / reading 52%, grade F, #10 of 40 statewide, top 26%, 1,088 students, 0% FRL) — zoned schools average 0% FRL vs 49% district-wide (49 pts lower); this property's tenant base skews higher-income than the district average.
- Market conditions: 1 comparable units currently listed for rent nearby; 4,354 units permitted in Sussex County in 2024 (344 in 5+ unit buildings).
- Sussex County population projected at +25% by 2050 — long-run rental-demand tailwind backs the buy-and-hold thesis.
- 4 sale attempts since 3y ago with the ask held roughly flat each time — persistent listings suggest the price (not the market) is what's stuck; bring a comps-based counter.
- Current owner paid $80k; list at $125k implies a 56% gain — meaningful room to come down on a strong offer.
- At projected returns (-3.0% appreciation + 3.0% rent growth), your $35k cash investment doubles in ~5 years — after that, you're playing with house money.
- Cap rate 13.2% vs local median 1.4% in Ocean City — top-decile yield for the area; either an underpriced asset or a hidden risk that comps aren't pricing in. Stress-test before assuming the spread holds.
Questions for listing agent
- Is there a deadline driving the sale (1031 exchange, divorce, estate, relocation)? That informs how much negotiation room exists.
- Schools are B-rated — typically a magnet for longer-tenancy family renters. What's the average tenant stay here, and is there a school-zone premium baked into asking?
- Crime grade is F in this area — have there been break-ins, vandalism, or insurance claims at this property in the last 3 years? What carrier currently insures it and at what premium?
- What's the average days-on-market for RENTAL listings here right now (not sales)? A rising rental-DOM trend means longer vacancies and softer asking-rent achievability than the comps imply.
- What's the recent tenant-quality profile in this submarket — average credit score on applications, eviction rate, late-payment / NSF rate, and stable-employment percentage? A property-management company in the area should have these aggregated.
- How much new for-sale + rental construction is in the pipeline within 1–3 miles? Heavy new supply typically softens prices + rents 12–24 months out; constrained supply supports both.
CashFlowRE · CFR-6MCMBPBCDG8MQA
· Data 2 days ago
cashflowre.app · 2026-05-29