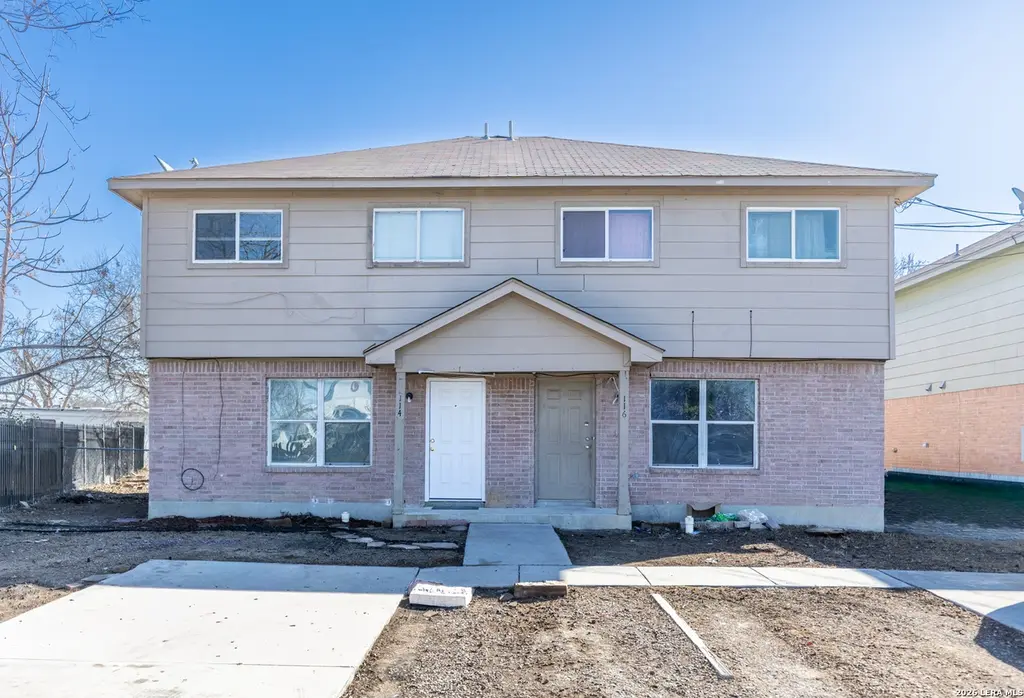
114 - 116 Garner St
San Antonio, TX 78237
$229,900B
6 bd · 5.0 ba ·
2,647 sqft ·
Built 2007
· MultiFamily
· Active
· 47 DOM
Cashflow @ list (25.0% down · 7.5%)
Estimated rent
$2,913/mo
Mortgage (P&I)
−$1,206
Tax + insurance
−$383
HOA
−$0
Vac / Maint / Mgmt
−$612
Net cashflow
$712/mo
Annual
$8,550/yr
Cap rate
10.01%
Cash-on-cash
13.28%
DSCR
1.59
1% rule
1.27%
Cash to close
$64,372
Investor read
- This is a 2 × 3-bed/1.5-bath units multifamily listed at $230k.
- At list price, monthly cash flow is $712 ($9k/yr) — positive. Per door: $356/mo.
- The deal already cash-flows at list — no discount required.
- Meets the 1% rule at list price ($3k rent vs $230k).
- It's been on market 47 days — a 3% lower offer ($223k) is reasonable based on typical stale-listing flexibility.
- Recommended offer: $223k (3.0% below list) — sets the bar for market timing.
- In year one you build about $25k of equity ($2k loan paydown + $23k appreciation (10.0% local appreciation)).
- Location reads 80/100 on livability (#31 in TX, #1,616 nationally) — a professional / high-income tenant draw. Strengths: amenities A+, commute A+, cost of living A+; Watch: crime F.
- Edgewood ISD (urban): math 12% / reading 21% proficiency, ranked #812 of 826 in TX (top 98%) — low school quality limits family demand, transient renter base, plan for 1-2y turnover.
- Zoned schools: H B Gonzalez El (math 12% / reading 17%, grade F, #4,048 of 4,322 statewide, top 95%, 401 students, 97% FRL); E T Wrenn Middle (math 11% / reading 22%, grade F, #1,536 of 1,662 statewide, top 93%, 496 students, 97% FRL); John F Kennedy H S (math 17% / reading 18%, grade F, #1,451 of 1,632 statewide, top 89%, 1,042 students, 92% FRL) — zoned schools average 95% FRL vs 24% district-wide (71 pts higher); higher-poverty schools than district average — tighter screening recommended.
- Market conditions: Rents rising fast (+6.1%/yr); 140 active listings in the ZIP; lower-income renter base — watch delinquency; 8,308 units permitted in Bexar County in 2024 (2,506 in 5+ unit buildings).
- Bexar County population projected at +50% by 2050 — long-run rental-demand tailwind backs the buy-and-hold thesis.
- 2 sale attempts with the ask held roughly flat each time — persistent listings suggest the price (not the market) is what's stuck; bring a comps-based counter.
- At projected returns (10.0% appreciation + 6.1% rent growth), your $64k cash investment doubles in ~2 years — after that, you're playing with house money.
- By year 2, paydown + projected appreciation supports a ~$40k cash-out refi (75% LTV) — recoverable capital for the next deal without selling this one.
- Climate carrying-cost: major wind risk, 77% chance of damaging wind over 30y; extreme-heat days projected 7→22/yr by 2055 (HVAC capex compounding) — expect insurance premiums to compound above CPI over the hold.
- Cap rate 10.0% vs local median 3.8% in San Antonio — top-decile yield for the area; either an underpriced asset or a hidden risk that comps aren't pricing in. Stress-test before assuming the spread holds.
- At $2,913/mo this rent would consume 82% of the median local household income ($43k/yr) (locally 1185% of renters already pay >50% of income on rent) — very limited rent-growth headroom before tenants either downsize or default.
Questions for listing agent
- It's been on market 47 days. Have you received any prior offers? Is the seller open to a 3% concession, seller financing, or rate buy-down credit?
- Can we see the unit-by-unit rent roll, current vacancy, and any below-market leases? What's the average tenancy length?
- What capital expenditures (roof, boiler, parking lot, exteriors) have been made in the last 5 years, and what's planned in the next 2?
- Is there a deadline driving the sale (1031 exchange, divorce, estate, relocation)? That informs how much negotiation room exists.
- Crime grade is F in this area — have there been break-ins, vandalism, or insurance claims at this property in the last 3 years? What carrier currently insures it and at what premium?
- What's the average days-on-market for RENTAL listings here right now (not sales)? A rising rental-DOM trend means longer vacancies and softer asking-rent achievability than the comps imply.
- What's the recent tenant-quality profile in this submarket — average credit score on applications, eviction rate, late-payment / NSF rate, and stable-employment percentage? A property-management company in the area should have these aggregated.
- How much new apartment / multifamily construction is in the pipeline within 1–3 miles? Heavy new supply (>2% of stock underway) typically softens rents 12–24 months out; light construction supports rent growth.
CashFlowRE · CFR-6PA7PG2HSW0AK9
· Data 11 h ago
cashflowre.app · 2026-05-29