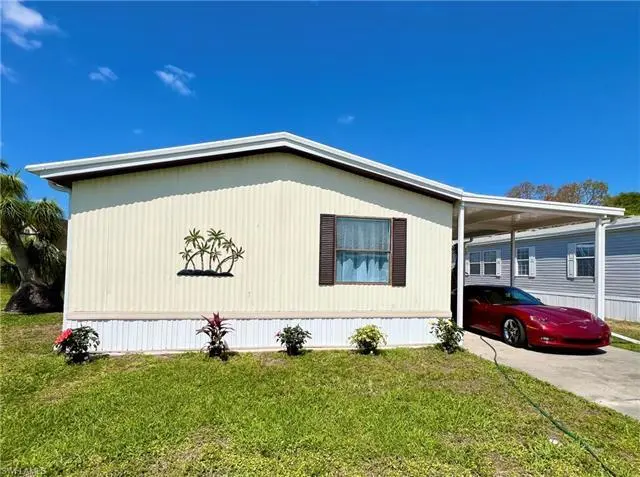
573 Cape Florida Ln
Berkshire Lakes, FL 34104
$229,000C+
3 bd · 2.0 ba ·
1,248 sqft ·
Built 1985
· Manufactured
· Active
· 38 DOM
Cashflow @ list (25.0% down · 7.5%)
Estimated rent
$2,854/mo
Mortgage (P&I)
−$1,201
Tax + insurance
−$252
HOA
−$188
Vac / Maint / Mgmt
−$599
Net cashflow
$614/mo
Annual
$7,364/yr
Cap rate
9.51%
Cash-on-cash
11.49%
DSCR
1.51
1% rule
1.25%
Cash to close
$64,120
Investor read
- This is a 3-bed/2.0-bath manufactured listed at $229k.
- At list price, monthly cash flow is $614 ($7k/yr) — positive.
- The deal already cash-flows at list — no discount required.
- Meets the 1% rule at list price ($3k rent vs $229k).
- It's been on market 38 days — a 3% lower offer ($222k) is reasonable based on typical stale-listing flexibility.
- Recommended offer: $222k (3.0% below list) — sets the bar for market timing.
- Local home prices are declining (-3.0%/yr); year-one equity from $2k of loan paydown is wiped out by about $7k of value loss. Plan a longer hold.
- Location reads: area grade C — affects rentability + tenant quality, not the cash-flow math above.
- Collier (suburban): math 60% / reading 56% proficiency, ranked #16 of 73 in FL (top 22%) — acceptable for families but not a draw, mixed tenant base, ~2y average lease.
- Market conditions: Rents soft (-1.1%/yr); 436 active listings in the ZIP; 40 comparable units currently listed for rent nearby; rentals at typical pace (median 22d on market — plan ~3-4 weeks tenant-placement turnaround); 3,520 units permitted in Collier County in 2024 (959 in 5+ unit buildings).
- Collier County population projected at +30% by 2050 — long-run rental-demand tailwind backs the buy-and-hold thesis.
- 3 sale attempts; this cycle's ask is 12622% above the opening price — seller raised mid-cycle; expect resistance to lowballs.
- Current owner paid $90k; list at $229k implies a 154% gain — meaningful room to come down on a strong offer.
- Climate carrying-cost: major flood risk; severe wind risk, 99% chance of damaging wind over 30y; extreme-heat days projected 7→28/yr by 2055 (HVAC capex compounding) — expect insurance premiums to compound above CPI over the hold.
- At $2,854/mo this rent would consume 48% of the median local household income ($72k/yr) (locally 1423% of renters already pay >50% of income on rent) — very limited rent-growth headroom before tenants either downsize or default.
Questions for listing agent
- It's been on market 38 days. Have you received any prior offers? Is the seller open to a 3% concession, seller financing, or rate buy-down credit?
- What does the HOA fee cover, when was the last increase, and are there any pending special assessments or reserve-fund shortfalls?
- Is there a deadline driving the sale (1031 exchange, divorce, estate, relocation)? That informs how much negotiation room exists.
- What's the average days-on-market for RENTAL listings here right now (not sales)? A rising rental-DOM trend means longer vacancies and softer asking-rent achievability than the comps imply.
- What's the recent tenant-quality profile in this submarket — average credit score on applications, eviction rate, late-payment / NSF rate, and stable-employment percentage? A property-management company in the area should have these aggregated.
- How much new for-sale + rental construction is in the pipeline within 1–3 miles? Heavy new supply typically softens prices + rents 12–24 months out; constrained supply supports both.
CashFlowRE · CFR-6QWTV72ZAHKBVM
· Data 2 days ago
cashflowre.app · 2026-05-29