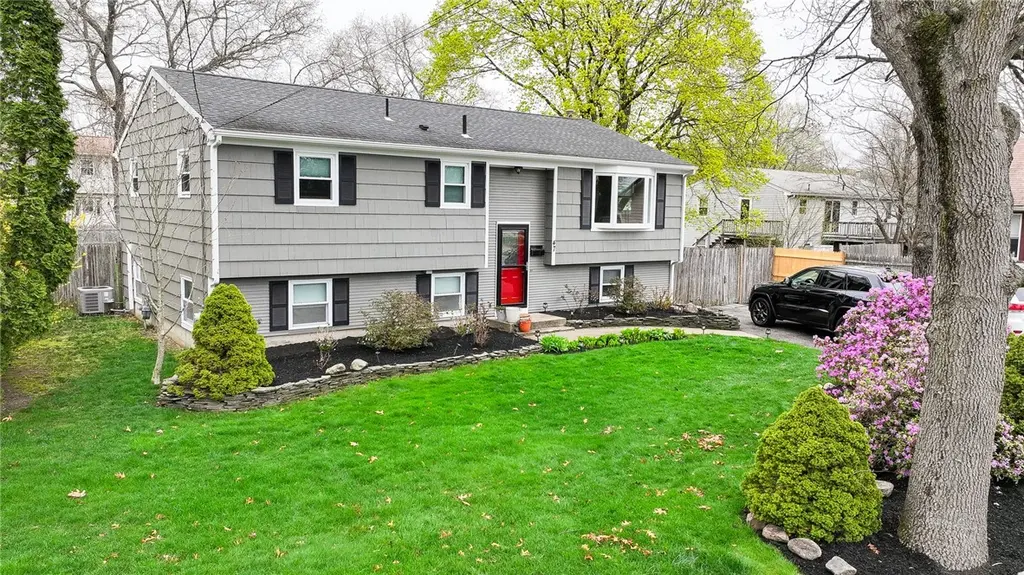
47 Long St
Warwick, RI 02888
$529,000F
3 bd · 1.0 ba ·
1,128 sqft ·
Built 1973
· SingleFamily
· Pending
· 7 DOM
Cashflow @ list (25.0% down · 7.5%)
Estimated rent
$2,549/mo
Mortgage (P&I)
−$2,774
Tax + insurance
−$608
HOA
−$0
Vac / Maint / Mgmt
−$535
Net cashflow
$-1,369/mo
Annual
$-16,427/yr
Cap rate
3.19%
Cash-on-cash
-11.09%
DSCR
0.51
1% rule
0.48%
Cash to close
$148,120
Investor read
- This is a 3-bed/1.0-bath single-family listed at $529k.
- At list price, monthly cash flow is $-1k ($-16k/yr) — negative.
- To cash-flow at today's rent, offer at most $287k (45.7% below list).
- To meet the 1% rule (rent ≥ 1% of price), the offer needs to be $255k (51.8% below list).
- Only 7 days on market — expect competitive offers; lowballing is unlikely to land.
- Recommended offer: $255k (51.8% below list) — sets the bar for 1% rule.
- Local home prices are declining (-3.0%/yr); year-one equity from $4k of loan paydown is wiped out by about $16k of value loss. Plan a longer hold.
- Location reads 78/100 on livability (#6 in RI, #2,425 nationally) — a middle-class / working-renter tenant base. Strengths: crime A+, commute A+, housing A+; Watch: amenities F.
- Warwick (urban): math 15% / reading 32% proficiency, ranked #25 of 39 in RI (top 64%) — low school quality limits family demand, transient renter base, plan for 1-2y turnover.
- Zoned schools: Park School (math 22% / reading 42%, grade F, #67 of 167 statewide, top 46%, 215 students, 31% FRL).
- Market conditions: 70 active listings in the ZIP; 5 comparable units currently listed for rent nearby; rentals at typical pace (median 23d on market — plan ~3-4 weeks tenant-placement turnaround); 40% of comp listings sitting > 30 days — soft ceiling on asking rent; 471 units permitted in Kent County in 2024 (240 in 5+ unit buildings).
- Kent County population projected at -14% by 2050 — secular population decline; favor cash flow + early exit over multi-decade hold.
- 4 sale attempts since 26y ago with the ask held roughly flat each time — persistent listings suggest the price (not the market) is what's stuck; bring a comps-based counter.
- Current owner paid $210k; list at $529k implies a 152% gain — meaningful room to come down on a strong offer.
- Climate carrying-cost: major wind risk, 75% chance of damaging wind over 30y; extreme-heat days projected 7→16/yr by 2055 (HVAC capex compounding) — expect insurance premiums to compound above CPI over the hold.
Questions for listing agent
- What do current leases actually rent for vs. the listed asking? Can we see a recent rent roll and the last 12 months of T-12 income?
- Built in 1973 — when were the roof, HVAC, electrical panel, plumbing, and water heater last replaced?
- Is there a deadline driving the sale (1031 exchange, divorce, estate, relocation)? That informs how much negotiation room exists.
- Schools are D-rated, which usually means shorter tenancies and higher turnover. Who's the typical renter profile here, and what's been the actual vacancy rate?
- The area grade is low — what's the realistic commute time and amenity access for the typical tenant pool here? Any planned neighborhood developments (good or bad) we should know about?
- What's the average days-on-market for RENTAL listings here right now (not sales)? A rising rental-DOM trend means longer vacancies and softer asking-rent achievability than the comps imply.
- What's the recent tenant-quality profile in this submarket — average credit score on applications, eviction rate, late-payment / NSF rate, and stable-employment percentage? A property-management company in the area should have these aggregated.
- How much new for-sale + rental construction is in the pipeline within 1–3 miles? Heavy new supply typically softens prices + rents 12–24 months out; constrained supply supports both.
CashFlowRE · CFR-6YE10H9Q8KNZTF
· Data 1 week ago
cashflowre.app · 2026-05-29