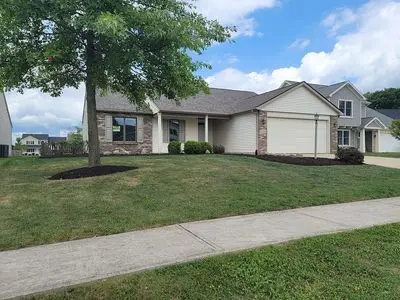
2728 Sapphire Ct
Huntertown, IN 46818
$264,900D-
3 bd · 2.0 ba ·
1,239 sqft ·
Built 2007
· SingleFamily
· Active
· 37 DOM
Cashflow @ list (25.0% down · 7.5%)
Estimated rent
$2,073/mo
Mortgage (P&I)
−$1,389
Tax + insurance
−$418
HOA
−$0
Vac / Maint / Mgmt
−$435
Net cashflow
$-170/mo
Annual
$-2,034/yr
Cap rate
5.53%
Cash-on-cash
-2.74%
DSCR
0.88
1% rule
0.78%
Cash to close
$74,172
Investor read
- This is a 3-bed/2.0-bath single-family listed at $265k.
- At list price, monthly cash flow is $-170 ($-2k/yr) — negative.
- To cash-flow at today's rent, offer at most $235k (11.3% below list).
- To meet the 1% rule (rent ≥ 1% of price), the offer needs to be $207k (21.7% below list).
- It's been on market 37 days — a 3% lower offer ($257k) is reasonable based on typical stale-listing flexibility.
- Recommended offer: $207k (21.7% below list) — sets the bar for 1% rule.
- Local home prices are declining (-3.0%/yr); year-one equity from $2k of loan paydown is wiped out by about $8k of value loss. Plan a longer hold.
- Location reads 70/100 on livability (#159 in IN) — a middle-class / working-renter tenant base. Strengths: employment A+, cost of living A+, housing A+; Watch: amenities F, commute F, health & safety F.
- Northwest Allen County Schools (rural): math 51% / reading 58% proficiency, ranked #25 of 301 in IN (top 8%) — acceptable for families but not a draw, mixed tenant base, ~2y average lease; only 11% free/reduced lunch — higher-income household profile.
- Market conditions: Rents rising fast (+7.6%/yr); 327 active listings in the ZIP; 1 comparable units currently listed for rent nearby; solid renter incomes; 1,861 units permitted in Allen County in 2024 (576 in 5+ unit buildings).
- Allen County population projected at +10% by 2050 — modest demand growth; plan on rents tracking national, not racing it.
- 2 sale attempts since 3y ago with the ask held roughly flat each time — persistent listings suggest the price (not the market) is what's stuck; bring a comps-based counter.
- Current owner paid $225k; 18% above their basis — modest negotiation headroom, anchor on the comps not their cost.
- Cap rate 5.5% vs local median 4.1% in Huntertown — top-decile yield for the area; either an underpriced asset or a hidden risk that comps aren't pricing in. Stress-test before assuming the spread holds.
- This rent runs 31% of the median local income ($81k/yr) — at the standard rent-burdened threshold; future hikes will face affordability resistance.
Questions for listing agent
- What do current leases actually rent for vs. the listed asking? Can we see a recent rent roll and the last 12 months of T-12 income?
- It's been on market 37 days. Have you received any prior offers? Is the seller open to a 22% concession, seller financing, or rate buy-down credit?
- Is there a deadline driving the sale (1031 exchange, divorce, estate, relocation)? That informs how much negotiation room exists.
- The area grade is low — what's the realistic commute time and amenity access for the typical tenant pool here? Any planned neighborhood developments (good or bad) we should know about?
- What's the average days-on-market for RENTAL listings here right now (not sales)? A rising rental-DOM trend means longer vacancies and softer asking-rent achievability than the comps imply.
- What's the recent tenant-quality profile in this submarket — average credit score on applications, eviction rate, late-payment / NSF rate, and stable-employment percentage? A property-management company in the area should have these aggregated.
- How much new for-sale + rental construction is in the pipeline within 1–3 miles? Heavy new supply typically softens prices + rents 12–24 months out; constrained supply supports both.
CashFlowRE · CFR-6Z33VFFQVNHVN9
· Data 2 days ago
cashflowre.app · 2026-05-29