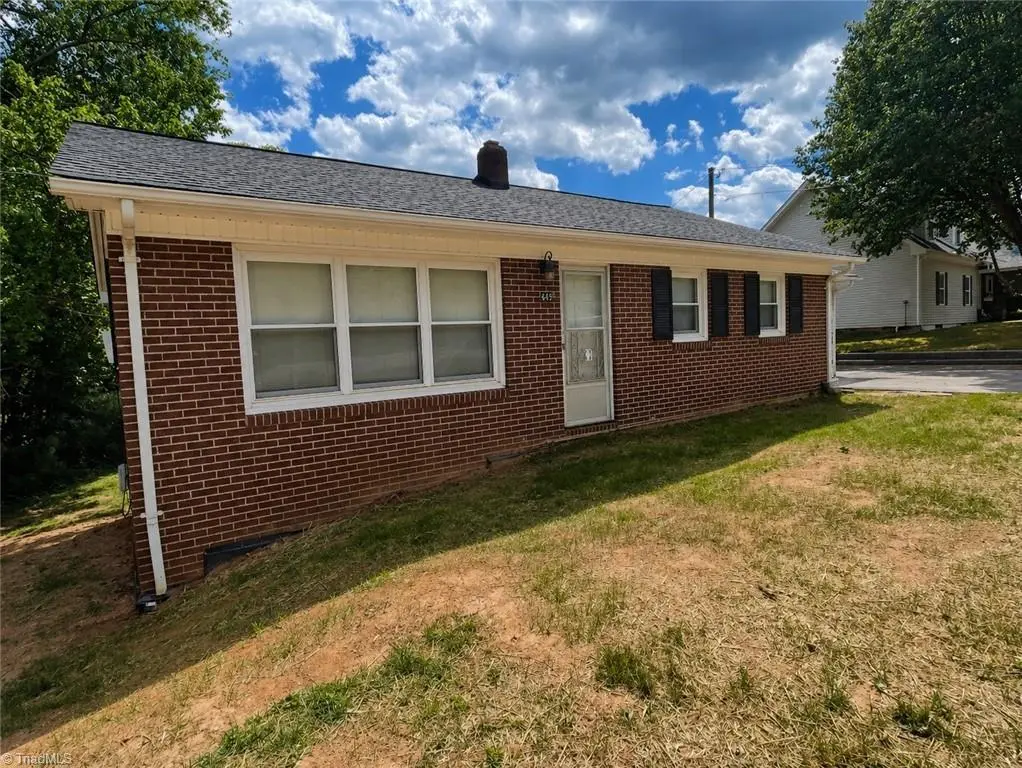
443 Pads Rd
Cricket, NC 28697
$194,500D-
3 bd · 1.0 ba ·
1,170 sqft ·
Built 1960
· SingleFamily
· Pending
· 5 DOM
Cashflow @ list (25.0% down · 7.5%)
Estimated rent
$1,427/mo
Mortgage (P&I)
−$1,020
Tax + insurance
−$150
HOA
−$0
Vac / Maint / Mgmt
−$300
Net cashflow
$-43/mo
Annual
$-511/yr
Cap rate
6.03%
Cash-on-cash
-0.94%
DSCR
0.96
1% rule
0.73%
Cash to close
$54,460
Investor read
- This is a 3-bed/1.0-bath single-family listed at $194k.
- At list price, monthly cash flow is $-43 ($-511/yr) — negative.
- To cash-flow at today's rent, offer at most $187k (3.9% below list).
- To meet the 1% rule (rent ≥ 1% of price), the offer needs to be $143k (26.6% below list).
- Only 5 days on market — expect competitive offers; lowballing is unlikely to land.
- Recommended offer: $143k (26.6% below list) — sets the bar for 1% rule.
- Local home prices are declining (-2.1%/yr); year-one equity from $1k of loan paydown is wiped out by about $4k of value loss. Plan a longer hold.
- Location reads 63/100 on livability (#419 in NC) — a middle-class / working-renter tenant base. Strengths: cost of living A+, housing A+, crime A-; Watch: health & safety C-, amenities F, commute F.
- Wilkes County Schools (rural): math 55% / reading 50% proficiency, ranked #59 of 178 in NC (top 33%) — acceptable for families but not a draw, mixed tenant base, ~2y average lease.
- Zoned schools: Millers Creek Elementary School (math 58% / reading 50%, grade C, #328 of 1,410 statewide, top 24%, 734 students, 100% FRL); West Wilkes Middle School (math 48% / reading 42%, grade D, #160 of 475 statewide, top 35%, 468 students, 99% FRL); West Wilkes High School (math 57% / reading 62%, grade C+, #216 of 535 statewide, top 43%, 628 students, 47% FRL) — zoned schools average 82% FRL vs 56% district-wide (25 pts higher); higher-poverty schools than district average — tighter screening recommended.
- Market conditions: 99 active listings in the ZIP; 134 units permitted in Wilkes County in 2024 (0 in 5+ unit buildings).
- Wilkes County population projected at -18% by 2050 — secular population decline; favor cash flow + early exit over multi-decade hold.
- 2 sale attempts with the ask held roughly flat each time — persistent listings suggest the price (not the market) is what's stuck; bring a comps-based counter.
- Climate carrying-cost: extreme-heat days projected 7→18/yr by 2055 (HVAC capex compounding) — expect insurance premiums to compound above CPI over the hold.
Questions for listing agent
- What do current leases actually rent for vs. the listed asking? Can we see a recent rent roll and the last 12 months of T-12 income?
- Built in 1960 — when were the roof, HVAC, electrical panel, plumbing, and water heater last replaced?
- Is there a deadline driving the sale (1031 exchange, divorce, estate, relocation)? That informs how much negotiation room exists.
- Schools are F-rated, which usually means shorter tenancies and higher turnover. Who's the typical renter profile here, and what's been the actual vacancy rate?
- The area grade is low — what's the realistic commute time and amenity access for the typical tenant pool here? Any planned neighborhood developments (good or bad) we should know about?
- What's the average days-on-market for RENTAL listings here right now (not sales)? A rising rental-DOM trend means longer vacancies and softer asking-rent achievability than the comps imply.
- What's the recent tenant-quality profile in this submarket — average credit score on applications, eviction rate, late-payment / NSF rate, and stable-employment percentage? A property-management company in the area should have these aggregated.
- How much new for-sale + rental construction is in the pipeline within 1–3 miles? Heavy new supply typically softens prices + rents 12–24 months out; constrained supply supports both.
CashFlowRE · CFR-6ZJNYS7B107RPF
· Data 4 weeks ago
cashflowre.app · 2026-05-29