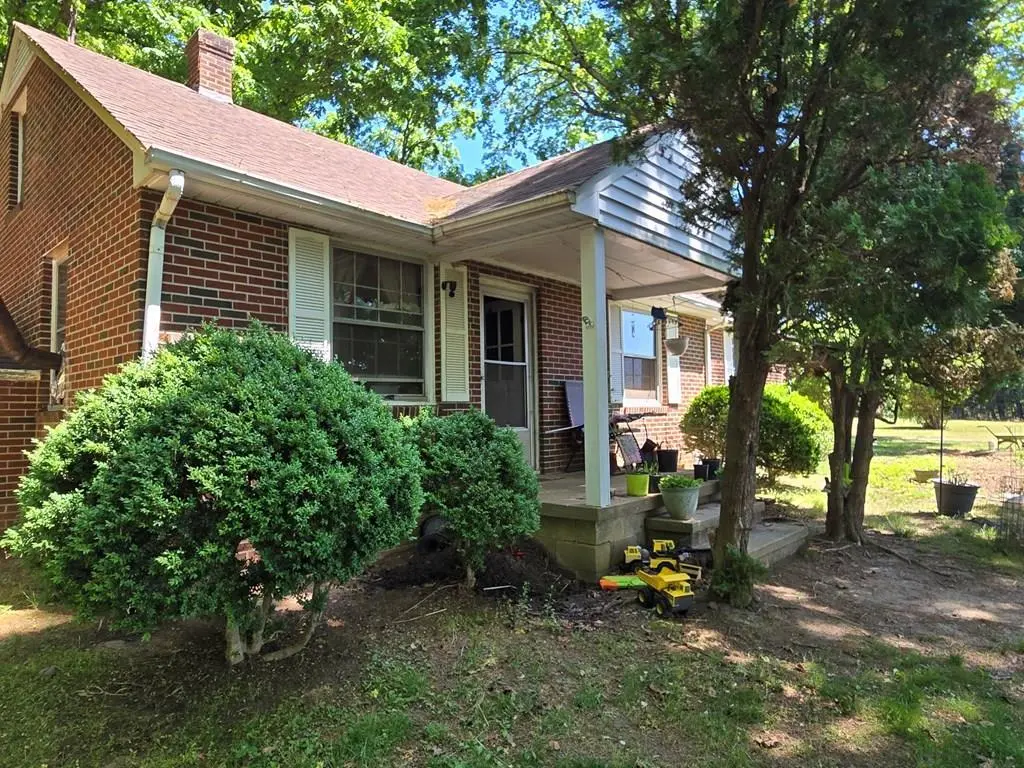
586 Hardtimes Rd
Hampden-Sydney, VA 23901
$179,900D
3 bd · 1.0 ba ·
1,396 sqft ·
Built 1955
· SingleFamily
· Pending
· 19 DOM
Cashflow @ list (25.0% down · 7.5%)
Estimated rent
$1,524/mo
Mortgage (P&I)
−$943
Tax + insurance
−$122
HOA
−$0
Vac / Maint / Mgmt
−$320
Net cashflow
$139/mo
Annual
$1,664/yr
Cap rate
7.22%
Cash-on-cash
3.30%
DSCR
1.15
1% rule
0.85%
Cash to close
$50,372
Investor read
- This is a 3-bed/1.0-bath single-family listed at $180k.
- At list price, monthly cash flow is $139 ($2k/yr) — positive.
- The deal already cash-flows at list — no discount required.
- To meet the 1% rule (rent ≥ 1% of price), the offer needs to be $152k (15.3% below list).
- It's been on market 19 days — a 2% lower offer ($177k) is reasonable based on typical stale-listing flexibility.
- Recommended offer: $152k (15.3% below list) — sets the bar for 1% rule.
- Local home prices are declining (-3.0%/yr); year-one equity from $1k of loan paydown is wiped out by about $5k of value loss. Plan a longer hold.
- Location reads: area grade D — affects rentability + tenant quality, not the cash-flow math above.
- Prince Edward County Public School District (town): math 25% / reading 48% proficiency, ranked #126 of 131 in VA (top 96%) — families likely to look elsewhere, expect single-tenant / working-renter base with shorter leases; 65% free/reduced lunch — lower-income household profile, screen leases tightly.
- Watch-outs: built in 1955 — expect roof / HVAC / electrical / plumbing capex.
- Market conditions: 151 active listings in the ZIP; 65 units permitted in Prince Edward County in 2024 (5 in 5+ unit buildings).
- Prince Edward County population projected to shrink 9% by 2050 — rents likely to lag national; underwrite the cash flow, not the appreciation.
- 3 sale attempts with the ask held roughly flat each time — persistent listings suggest the price (not the market) is what's stuck; bring a comps-based counter.
- Current owner paid $150k; 20% above their basis — modest negotiation headroom, anchor on the comps not their cost.
- Climate carrying-cost: extreme-heat days projected 7→17/yr by 2055 (HVAC capex compounding) — expect insurance premiums to compound above CPI over the hold.
- Cap rate 7.2% vs local median 2.2% in Hampden-Sydney — top-decile yield for the area; either an underpriced asset or a hidden risk that comps aren't pricing in. Stress-test before assuming the spread holds.
Questions for listing agent
- Built in 1955 — when were the roof, HVAC, electrical panel, plumbing, and water heater last replaced?
- Is there a deadline driving the sale (1031 exchange, divorce, estate, relocation)? That informs how much negotiation room exists.
- The area grade is low — what's the realistic commute time and amenity access for the typical tenant pool here? Any planned neighborhood developments (good or bad) we should know about?
- What's the average days-on-market for RENTAL listings here right now (not sales)? A rising rental-DOM trend means longer vacancies and softer asking-rent achievability than the comps imply.
- What's the recent tenant-quality profile in this submarket — average credit score on applications, eviction rate, late-payment / NSF rate, and stable-employment percentage? A property-management company in the area should have these aggregated.
- How much new for-sale + rental construction is in the pipeline within 1–3 miles? Heavy new supply typically softens prices + rents 12–24 months out; constrained supply supports both.
CashFlowRE · CFR-70FE2YDPXN0GEB
· Data 3 weeks ago
cashflowre.app · 2026-05-29