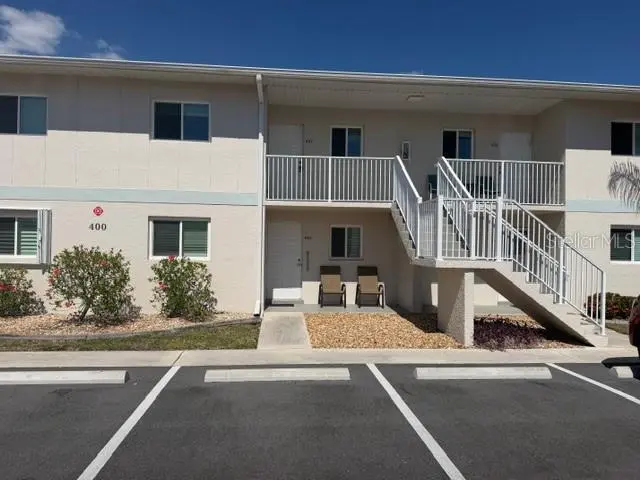
12538 SW Kingsway Cir #403
North Port, FL 34269
$174,900D
2 bd · 2.0 ba ·
871 sqft ·
Built 1987
· Condo
· Active
· 48 DOM
Cashflow @ list (25.0% down · 7.5%)
Estimated rent
$1,738/mo
Mortgage (P&I)
−$917
Tax + insurance
−$262
HOA
−$233
Vac / Maint / Mgmt
−$365
Net cashflow
$-39/mo
Annual
$-465/yr
Cap rate
6.03%
Cash-on-cash
-0.95%
DSCR
0.96
1% rule
0.99%
Cash to close
$48,972
Investor read
- This is a 2-bed/2.0-bath condo listed at $175k.
- At list price, monthly cash flow is $-39 ($-465/yr) — negative.
- To cash-flow at today's rent, offer at most $168k (3.9% below list).
- To meet the 1% rule (rent ≥ 1% of price), the offer needs to be $174k (0.6% below list).
- It's been on market 48 days — a 3% lower offer ($170k) is reasonable based on typical stale-listing flexibility.
- Recommended offer: $168k (3.9% below list) — sets the bar for cash-flow.
- Local home prices are declining (-3.0%/yr); year-one equity from $1k of loan paydown is wiped out by about $5k of value loss. Plan a longer hold.
- Location reads 75/100 on livability (#252 in FL, #3,975 nationally) — a middle-class / working-renter tenant base. Strengths: crime A+, housing A+, health & safety A+; Watch: amenities F, commute F.
- Desoto (town): math 31% / reading 32% proficiency, ranked #69 of 73 in FL (top 94%) — families likely to look elsewhere, expect single-tenant / working-renter base with shorter leases; 71% free/reduced lunch — lower-income household profile, screen leases tightly.
- Market conditions: 149 active listings in the ZIP; 4 comparable units currently listed for rent nearby; rentals leasing fast (median 14d on market — plan ~1-2 weeks tenant-placement turnaround); 71 units permitted in DeSoto County in 2024 (0 in 5+ unit buildings).
- DeSoto County population projected at -10% by 2050 — secular population decline; favor cash flow + early exit over multi-decade hold.
- 9 sale attempts since 20y ago with the ask held roughly flat each time — persistent listings suggest the price (not the market) is what's stuck; bring a comps-based counter.
- Climate carrying-cost: severe wind risk, 99% chance of damaging wind over 30y; extreme-heat days projected 7→28/yr by 2055 (HVAC capex compounding) — expect insurance premiums to compound above CPI over the hold.
- Cap rate 6.0% vs local median 3.6% in North Port — top-decile yield for the area; either an underpriced asset or a hidden risk that comps aren't pricing in. Stress-test before assuming the spread holds.
Questions for listing agent
- What do current leases actually rent for vs. the listed asking? Can we see a recent rent roll and the last 12 months of T-12 income?
- It's been on market 48 days. Have you received any prior offers? Is the seller open to a 4% concession, seller financing, or rate buy-down credit?
- What does the HOA fee cover, when was the last increase, and are there any pending special assessments or reserve-fund shortfalls?
- Any open or pending special assessments — roof, HVAC, plumbing, elevator, façade? What's the per-unit balance and payoff schedule, and is the seller paying it off at close or rolling it to the buyer?
- Is there a deadline driving the sale (1031 exchange, divorce, estate, relocation)? That informs how much negotiation room exists.
- Schools are B-rated — typically a magnet for longer-tenancy family renters. What's the average tenant stay here, and is there a school-zone premium baked into asking?
- The area grade is low — what's the realistic commute time and amenity access for the typical tenant pool here? Any planned neighborhood developments (good or bad) we should know about?
- What's the average days-on-market for RENTAL listings here right now (not sales)? A rising rental-DOM trend means longer vacancies and softer asking-rent achievability than the comps imply.
CashFlowRE · CFR-71ZABJ2MTY5MXZ
· Data 2 days ago
cashflowre.app · 2026-05-29