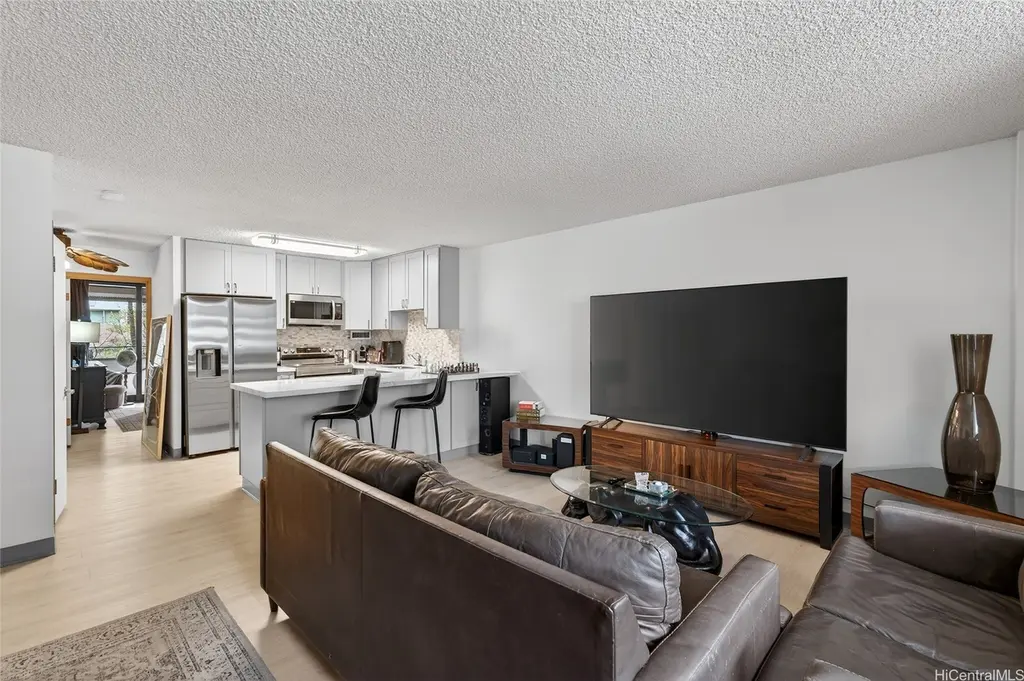
1720 Ala Moana Blvd Unit 407A
Urban Honolulu, HI 96815
$169,000B-
2 bd · 1.0 ba ·
898 sqft ·
Built 1961
· Other
· Active
· 50 DOM
Cashflow @ list (25.0% down · 7.5%)
Estimated rent
$3,606/mo
Mortgage (P&I)
−$886
Tax + insurance
−$708
HOA
−$1,544
Vac / Maint / Mgmt
−$757
Net cashflow
$-289/mo
Annual
$-3,474/yr
Cap rate
7.27%
Cash-on-cash
3.48%
DSCR
1.15
1% rule
2.13%
Cash to close
$47,320
Investor read
- This is a 2-bed/1.0-bath other listed at $169k.
- At list price, monthly cash flow is $-289 ($-3k/yr) — negative.
- To cash-flow at today's rent, offer at most $127k (24.8% below list).
- Meets the 1% rule at list price ($4k rent vs $169k).
- It's been on market 50 days — a 3% lower offer ($164k) is reasonable based on typical stale-listing flexibility.
- Recommended offer: $127k (24.8% below list) — sets the bar for cash-flow.
- In year one you build about $6k of equity ($1k loan paydown + $5k appreciation (2.7% local appreciation)).
- Location reads: area grade B — affects rentability + tenant quality, not the cash-flow math above.
- Hawaii Department Of Education (suburban): math 32% / reading 50% proficiency, ranked #1 of 1 in HI (top 100%) — families likely to look elsewhere, expect single-tenant / working-renter base with shorter leases.
- Watch-outs: flood insurance adds $427/mo; HOA is 43% of rent.
- Market conditions: Rents rising fast (+6.0%/yr); 814 active listings in the ZIP; 40 comparable units currently listed for rent nearby; rentals at typical pace (median 17d on market — plan ~3-4 weeks tenant-placement turnaround); solid renter incomes; 1,638 units permitted in Honolulu County in 2024 (793 in 5+ unit buildings).
- Honolulu County population projected at +17% by 2050 — long-run rental-demand tailwind backs the buy-and-hold thesis.
- 7 sale attempts since 4y ago; this cycle's ask has dropped $11k (6%) from the opening price — seller is motivated, your offer sets the floor, not the list.
- By year 6, paydown + projected appreciation supports a ~$31k cash-out refi (75% LTV) — recoverable capital for the next deal without selling this one.
- Climate carrying-cost: in FEMA flood zone AE (mandatory federal flood insurance) — expect insurance premiums to compound above CPI over the hold.
- Cap rate 7.3% vs local median 1.5% in Urban Honolulu — top-decile yield for the area; either an underpriced asset or a hidden risk that comps aren't pricing in. Stress-test before assuming the spread holds.
- At $3,606/mo this rent would consume 56% of the median local household income ($77k/yr) (locally 2422% of renters already pay >50% of income on rent) — very limited rent-growth headroom before tenants either downsize or default.
Questions for listing agent
- What do current leases actually rent for vs. the listed asking? Can we see a recent rent roll and the last 12 months of T-12 income?
- It's been on market 50 days. Have you received any prior offers? Is the seller open to a 25% concession, seller financing, or rate buy-down credit?
- Built in 1961 — when were the roof, HVAC, electrical panel, plumbing, and water heater last replaced?
- What's the actual annual flood-insurance premium (NFIP or private), and is the property in a SFHA with mandatory coverage?
- What does the HOA fee cover, when was the last increase, and are there any pending special assessments or reserve-fund shortfalls?
- Is there a deadline driving the sale (1031 exchange, divorce, estate, relocation)? That informs how much negotiation room exists.
- What's the average days-on-market for RENTAL listings here right now (not sales)? A rising rental-DOM trend means longer vacancies and softer asking-rent achievability than the comps imply.
- What's the recent tenant-quality profile in this submarket — average credit score on applications, eviction rate, late-payment / NSF rate, and stable-employment percentage? A property-management company in the area should have these aggregated.
CashFlowRE · CFR-73VQ5M3HADT7PB
· Data 2 days ago
cashflowre.app · 2026-05-29