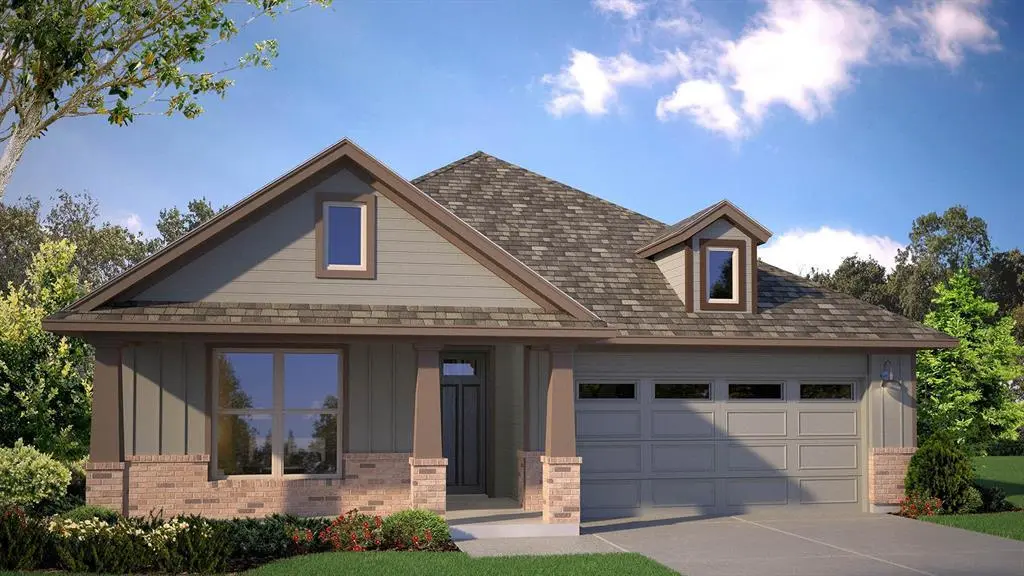
2513 Starling St
Denton, TX 76205
$434,990F
4 bd · 2.5 ba ·
2,089 sqft ·
Built 2026
· Land
· Active
· 122 DOM
Cashflow @ list (25.0% down · 7.5%)
Estimated rent
$2,596/mo
Mortgage (P&I)
−$2,281
Tax + insurance
−$264
HOA
−$67
Vac / Maint / Mgmt
−$545
Net cashflow
$-561/mo
Annual
$-6,736/yr
Cap rate
4.74%
Cash-on-cash
-5.53%
DSCR
0.75
1% rule
0.60%
Cash to close
$121,797
Investor read
- This is a 4-bed/2.5-bath land listed at $435k.
- At list price, monthly cash flow is $-561 ($-7k/yr) — negative.
- To cash-flow at today's rent, offer at most $336k (22.8% below list).
- To meet the 1% rule (rent ≥ 1% of price), the offer needs to be $260k (40.3% below list).
- It's been on market 122 days — a 12% lower offer ($383k) is reasonable based on typical stale-listing flexibility.
- Recommended offer: $260k (40.3% below list) — sets the bar for 1% rule.
- Local home prices are declining (-3.0%/yr); year-one equity from $3k of loan paydown is wiped out by about $13k of value loss. Plan a longer hold.
- Location reads 88/100 on livability (#2 in TX, #210 nationally) — a professional / high-income tenant draw. Strengths: amenities A+, commute A+, housing A+.
- Denton ISD (urban): math 36% / reading 43% proficiency, ranked #383 of 826 in TX (top 46%) — families likely to look elsewhere, expect single-tenant / working-renter base with shorter leases.
- Market conditions: Rents falling (-3.4%/yr); 171 active listings in the ZIP; 27 comparable units currently listed for rent nearby; rentals lingering (median 45d on market — plan ~5-8 weeks vacancy on turnover, expect pricing pressure); 52% of comp listings sitting > 30 days — soft ceiling on asking rent; 10,531 units permitted in Denton County in 2024 (2,713 in 5+ unit buildings).
- Denton County population projected at +66% by 2050 — long-run rental-demand tailwind backs the buy-and-hold thesis.
- 2 sale attempts with the ask held roughly flat each time — persistent listings suggest the price (not the market) is what's stuck; bring a comps-based counter.
- Cap rate 4.7% vs local median 3.4% in Denton — top-decile yield for the area; either an underpriced asset or a hidden risk that comps aren't pricing in. Stress-test before assuming the spread holds.
- At $2,596/mo this rent would consume 45% of the median local household income ($69k/yr) (locally 1268% of renters already pay >50% of income on rent) — very limited rent-growth headroom before tenants either downsize or default.
Questions for listing agent
- What do current leases actually rent for vs. the listed asking? Can we see a recent rent roll and the last 12 months of T-12 income?
- It's been on market 122 days. Have you received any prior offers? Is the seller open to a 40% concession, seller financing, or rate buy-down credit?
- What does the HOA fee cover, when was the last increase, and are there any pending special assessments or reserve-fund shortfalls?
- Why hasn't it sold? Are there any deal-killer items the seller is aware of (foundation, flood, title, zoning, code violations)?
- Is there a deadline driving the sale (1031 exchange, divorce, estate, relocation)? That informs how much negotiation room exists.
- Schools are B-rated — typically a magnet for longer-tenancy family renters. What's the average tenant stay here, and is there a school-zone premium baked into asking?
- The area grade is low — what's the realistic commute time and amenity access for the typical tenant pool here? Any planned neighborhood developments (good or bad) we should know about?
- What's the average days-on-market for RENTAL listings here right now (not sales)? A rising rental-DOM trend means longer vacancies and softer asking-rent achievability than the comps imply.
CashFlowRE · CFR-74136J6N2RX09K
· Data 10 h ago
cashflowre.app · 2026-05-29