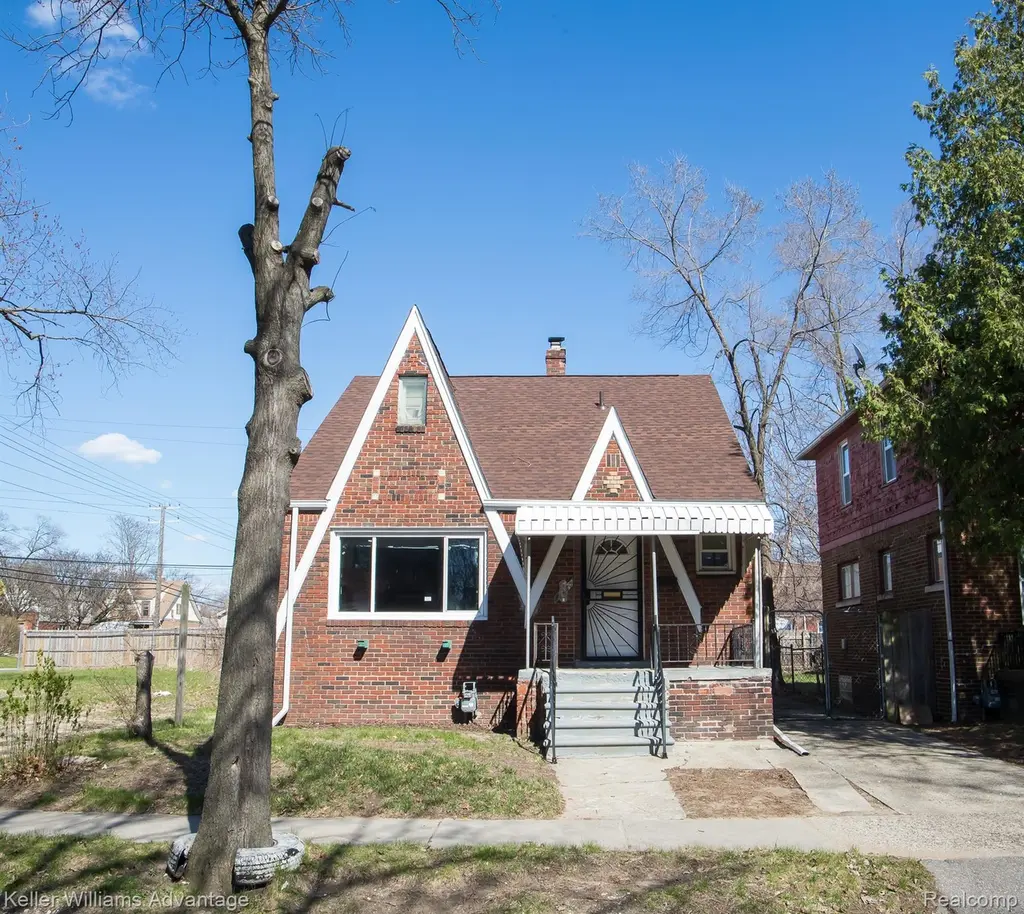
16250 Ardmore St
Detroit, MI 48235
$122,500C
4 bd · 1.0 ba ·
1,125 sqft ·
Built 1930
· SingleFamily
· Active
· 28 DOM
Cashflow @ list (25.0% down · 7.5%)
Estimated rent
$1,486/mo
Mortgage (P&I)
−$642
Tax + insurance
−$269
HOA
−$0
Vac / Maint / Mgmt
−$312
Net cashflow
$263/mo
Annual
$3,154/yr
Cap rate
8.87%
Cash-on-cash
9.19%
DSCR
1.41
1% rule
1.21%
Cash to close
$34,300
Investor read
- This is a 4-bed/1.0-bath single-family listed at $122k.
- At list price, monthly cash flow is $263 ($3k/yr) — positive.
- The deal already cash-flows at list — no discount required.
- Meets the 1% rule at list price ($1k rent vs $122k).
- It's been on market 28 days — a 2% lower offer ($121k) is reasonable based on typical stale-listing flexibility.
- Recommended offer: $121k (1.5% below list) — sets the bar for market timing.
- Local home prices are declining (-3.0%/yr); year-one equity from $847 of loan paydown is wiped out by about $4k of value loss. Plan a longer hold.
- Location reads 73/100 on livability (#218 in MI) — a middle-class / working-renter tenant base. Strengths: amenities A+, commute A+, cost of living A+; Watch: schools F, crime F, employment F.
- Detroit Public Schools Community District (urban): math 10% / reading 24% proficiency, ranked #499 of 540 in MI (top 92%) — low school quality limits family demand, transient renter base, plan for 1-2y turnover; 90% free/reduced lunch — lower-income household profile, screen leases tightly.
- Watch-outs: built in 1930 — expect roof / HVAC / electrical / plumbing capex.
- Market conditions: Rents rising (+3.2%/yr); 283 active listings in the ZIP; 40 comparable units currently listed for rent nearby; rentals at typical pace (median 18d on market — plan ~3-4 weeks tenant-placement turnaround); lower-income renter base — watch delinquency; 2,639 units permitted in Wayne County in 2024 (1,216 in 5+ unit buildings).
- Wayne County population projected at -17% by 2050 — secular population decline; favor cash flow + early exit over multi-decade hold.
- 15 sale attempts since 15y ago; this cycle's ask has dropped $8k (6%) from the opening price — seller is motivated, your offer sets the floor, not the list.
- Current owner paid $43k; list at $122k implies a 185% gain — meaningful room to come down on a strong offer.
- At $1,486/mo this rent would consume 45% of the median local household income ($39k/yr) (locally 3064% of renters already pay >50% of income on rent) — very limited rent-growth headroom before tenants either downsize or default.
Questions for listing agent
- Built in 1930 — when were the roof, HVAC, electrical panel, plumbing, and water heater last replaced?
- Is there a deadline driving the sale (1031 exchange, divorce, estate, relocation)? That informs how much negotiation room exists.
- Schools are F-rated, which usually means shorter tenancies and higher turnover. Who's the typical renter profile here, and what's been the actual vacancy rate?
- Crime grade is F in this area — have there been break-ins, vandalism, or insurance claims at this property in the last 3 years? What carrier currently insures it and at what premium?
- What's the average days-on-market for RENTAL listings here right now (not sales)? A rising rental-DOM trend means longer vacancies and softer asking-rent achievability than the comps imply.
- What's the recent tenant-quality profile in this submarket — average credit score on applications, eviction rate, late-payment / NSF rate, and stable-employment percentage? A property-management company in the area should have these aggregated.
- How much new for-sale + rental construction is in the pipeline within 1–3 miles? Heavy new supply typically softens prices + rents 12–24 months out; constrained supply supports both.
CashFlowRE · CFR-76P9055PBS5EB8
· Data 2 days ago
cashflowre.app · 2026-05-29