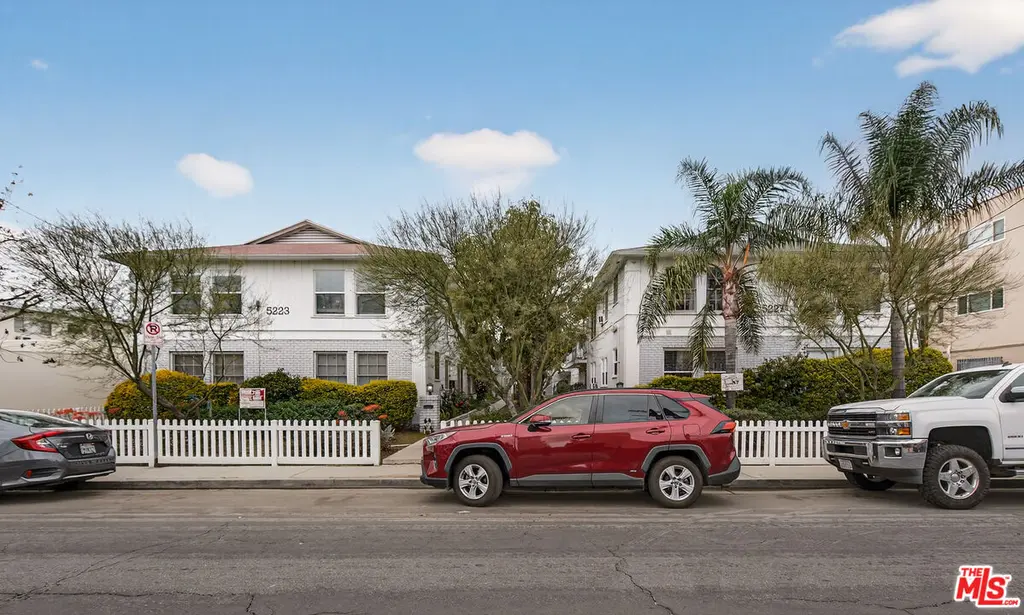
5227 Corteen Pl
Los Angeles, CA 91607
$2,725,000C+
18 bd · 16.0 ba ·
11,202 sqft ·
Built 1956
· MultiFamily
· Pending
· 68 DOM
Cashflow @ list (25.0% down · 7.5%)
Estimated rent
$29,915/mo
Mortgage (P&I)
−$14,290
Tax + insurance
−$4,033
HOA
−$0
Vac / Maint / Mgmt
−$6,282
Net cashflow
$5,310/mo
Annual
$63,719/yr
Cap rate
8.63%
Cash-on-cash
8.35%
DSCR
1.37
1% rule
1.10%
Cash to close
$763,000
Investor read
- This is a 5×2bd/1ba + 5×3bd/1ba units multifamily listed at $2.73M.
- At list price, monthly cash flow is $5k ($64k/yr) — positive. Per door: $531/mo.
- The deal already cash-flows at list — no discount required.
- Meets the 1% rule at list price ($30k rent vs $2.73M).
- It's been on market 68 days — a 6% lower offer ($2.56M) is reasonable based on typical stale-listing flexibility.
- Recommended offer: $2.56M (6.0% below list) — sets the bar for market timing.
- Local home prices are declining (-3.0%/yr); year-one equity from $19k of loan paydown is wiped out by about $82k of value loss. Plan a longer hold.
- Location reads 68/100 on livability (#273 in CA) — a middle-class / working-renter tenant base. Strengths: amenities A+, commute A+, employment B; Watch: health & safety C-, schools D+, crime F.
- Los Angeles Unified (urban): math 29% / reading 54% proficiency, ranked #223 of 517 in CA (top 43%) — families likely to look elsewhere, expect single-tenant / working-renter base with shorter leases; 67% free/reduced lunch — lower-income household profile, screen leases tightly.
- Watch-outs: built in 1956 — expect roof / HVAC / electrical / plumbing capex.
- Market conditions: Rents soft (-1.1%/yr); 90 active listings in the ZIP; solid renter incomes; 19,697 units permitted in Los Angeles County in 2024 (9,426 in 5+ unit buildings).
- Los Angeles County population projected at +9% by 2050 — modest demand growth; plan on rents tracking national, not racing it.
- 3 sale attempts since 3y ago; this cycle's ask has dropped $875k (24%) from the opening price — seller is motivated, your offer sets the floor, not the list.
- Climate carrying-cost: extreme-heat days projected 8→23/yr by 2055 (HVAC capex compounding) — expect insurance premiums to compound above CPI over the hold.
- Cap rate 8.6% vs local median 2.1% in Los Angeles — top-decile yield for the area; either an underpriced asset or a hidden risk that comps aren't pricing in. Stress-test before assuming the spread holds.
- At $29,915/mo this rent would consume 409% of the median local household income ($88k/yr) (locally 3099% of renters already pay >50% of income on rent) — very limited rent-growth headroom before tenants either downsize or default.
Questions for listing agent
- It's been on market 68 days. Have you received any prior offers? Is the seller open to a 6% concession, seller financing, or rate buy-down credit?
- Can we see the unit-by-unit rent roll, current vacancy, and any below-market leases? What's the average tenancy length?
- What capital expenditures (roof, boiler, parking lot, exteriors) have been made in the last 5 years, and what's planned in the next 2?
- Built in 1956 — when were the roof, HVAC, electrical panel, plumbing, and water heater last replaced?
- Why hasn't it sold? Are there any deal-killer items the seller is aware of (foundation, flood, title, zoning, code violations)?
- Is there a deadline driving the sale (1031 exchange, divorce, estate, relocation)? That informs how much negotiation room exists.
- Schools are D-rated, which usually means shorter tenancies and higher turnover. Who's the typical renter profile here, and what's been the actual vacancy rate?
- Crime grade is F in this area — have there been break-ins, vandalism, or insurance claims at this property in the last 3 years? What carrier currently insures it and at what premium?
CashFlowRE · CFR-7A2PJ4ASVEH37B
· Data 3 weeks ago
cashflowre.app · 2026-05-29