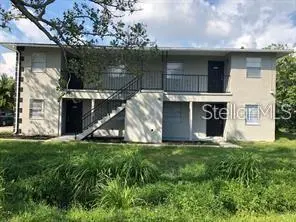
4415 Barna Ave
Titusville, FL 32780
$495,000C+
8 bd · 4.0 ba ·
3,104 sqft ·
Built 1983
· MultiFamily
· Pending
· 8 DOM
Cashflow @ list (25.0% down · 7.5%)
Estimated rent
$5,754/mo
Mortgage (P&I)
−$2,596
Tax + insurance
−$825
HOA
−$0
Vac / Maint / Mgmt
−$1,208
Net cashflow
$1,125/mo
Annual
$13,498/yr
Cap rate
9.02%
Cash-on-cash
9.74%
DSCR
1.43
1% rule
1.16%
Cash to close
$138,600
Investor read
- This is a 4 × 2-bed/1-bath units multifamily listed at $495k. Condition is rated good.
- At list price, monthly cash flow is $1k ($13k/yr) — positive. Per door: $281/mo.
- The deal already cash-flows at list — no discount required.
- Meets the 1% rule at list price ($6k rent vs $495k).
- Only 8 days on market — expect competitive offers; lowballing is unlikely to land.
- Local home prices are declining (-3.0%/yr); year-one equity from $3k of loan paydown is wiped out by about $15k of value loss. Plan a longer hold.
- Location reads 84/100 on livability (#42 in FL, #668 nationally) — a professional / high-income tenant draw. Strengths: commute A+, cost of living A+, housing A+; Watch: crime D, employment D.
- Brevard (suburban): math 53% / reading 57% proficiency, ranked #19 of 73 in FL (top 26%) — acceptable for families but not a draw, mixed tenant base, ~2y average lease.
- Zoned schools: Coquina Elementary School (math 38% / reading 45%, grade F, #1,437 of 2,144 statewide, top 68%, 557 students, 75% FRL); Andrew Jackson Middle School (math 52% / reading 47%, grade C, #259 of 571 statewide, top 46%, 551 students, 58% FRL); Titusville High School (math 33% / reading 52%, grade F, #264 of 667 statewide, top 41%, 1,314 students, 55% FRL) — zoned schools average 63% FRL vs 43% district-wide (20 pts higher); higher-poverty schools than district average — tighter screening recommended.
- Market conditions: Rents rising (+1.3%/yr); 465 active listings in the ZIP; 4,602 units permitted in Brevard County in 2024 (702 in 5+ unit buildings).
- Brevard County population projected at +15% by 2050 — modest demand growth; plan on rents tracking national, not racing it.
- 8 sale attempts since 11y ago with the ask held roughly flat each time — persistent listings suggest the price (not the market) is what's stuck; bring a comps-based counter.
- Current owner paid $257k; list at $495k implies a 93% gain — meaningful room to come down on a strong offer.
- Climate carrying-cost: severe wind risk, 99% chance of damaging wind over 30y; extreme-heat days projected 7→22/yr by 2055 (HVAC capex compounding) — expect insurance premiums to compound above CPI over the hold.
- At $5,754/mo this rent would consume 102% of the median local household income ($68k/yr) (locally 1141% of renters already pay >50% of income on rent) — very limited rent-growth headroom before tenants either downsize or default.
Questions for listing agent
- Can we see the unit-by-unit rent roll, current vacancy, and any below-market leases? What's the average tenancy length?
- What capital expenditures (roof, boiler, parking lot, exteriors) have been made in the last 5 years, and what's planned in the next 2?
- Is there a deadline driving the sale (1031 exchange, divorce, estate, relocation)? That informs how much negotiation room exists.
- Crime grade is D in this area — have there been break-ins, vandalism, or insurance claims at this property in the last 3 years? What carrier currently insures it and at what premium?
- What's the average days-on-market for RENTAL listings here right now (not sales)? A rising rental-DOM trend means longer vacancies and softer asking-rent achievability than the comps imply.
- What's the recent tenant-quality profile in this submarket — average credit score on applications, eviction rate, late-payment / NSF rate, and stable-employment percentage? A property-management company in the area should have these aggregated.
- How much new apartment / multifamily construction is in the pipeline within 1–3 miles? Heavy new supply (>2% of stock underway) typically softens rents 12–24 months out; light construction supports rent growth.
CashFlowRE · CFR-7A380Q4KZMXXF9
· Data 1 week ago
cashflowre.app · 2026-05-29