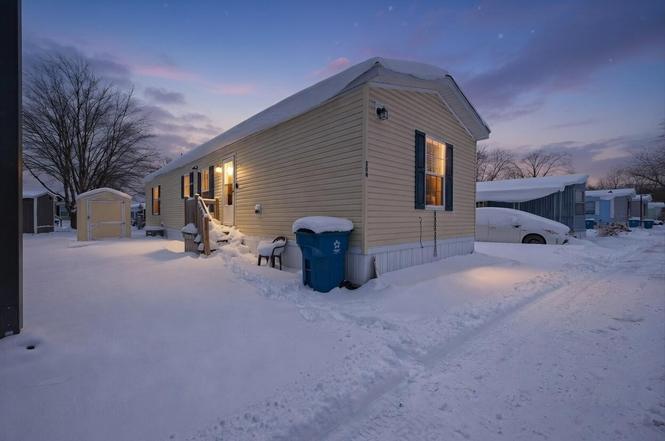
333 E Lakewood Blvd #104
Beechwood, MI 49424
$74,900C-
2 bd · 2.0 ba ·
930 sqft ·
Built 2022
· Manufactured
· Pending
· 38 DOM
Cashflow @ list (25.0% down · 7.5%)
Estimated rent
$1,639/mo
Mortgage (P&I)
−$393
Tax + insurance
−$125
HOA
−$695
Vac / Maint / Mgmt
−$344
Net cashflow
$82/mo
Annual
$985/yr
Cap rate
7.61%
Cash-on-cash
4.70%
DSCR
1.21
1% rule
2.19%
Cash to close
$20,972
Investor read
- This is a 2-bed/2.0-bath manufactured listed at $75k.
- At list price, monthly cash flow is $82 ($985/yr) — positive.
- The deal already cash-flows at list — no discount required.
- Meets the 1% rule at list price ($2k rent vs $75k).
- It's been on market 38 days — a 3% lower offer ($73k) is reasonable based on typical stale-listing flexibility.
- Recommended offer: $73k (3.0% below list) — sets the bar for market timing.
- Local home prices are declining (-3.0%/yr); year-one equity from $518 of loan paydown is wiped out by about $2k of value loss. Plan a longer hold.
- Location reads 86/100 on livability (#21 in MI, #378 nationally) — a professional / high-income tenant draw. Strengths: crime A+, cost of living A+, housing A+; Watch: employment D, schools F.
- West Ottawa Public School District (suburban): math 37% / reading 52% proficiency, ranked #140 of 540 in MI (top 26%) — families likely to look elsewhere, expect single-tenant / working-renter base with shorter leases.
- Watch-outs: HOA is 42% of rent.
- Market conditions: Rents rising fast (+5.1%/yr); 343 active listings in the ZIP; 4 comparable units currently listed for rent nearby; rentals at typical pace (median 14d on market — plan ~3-4 weeks tenant-placement turnaround); solid renter incomes; 1,237 units permitted in Ottawa County in 2024 (443 in 5+ unit buildings).
- Ottawa County population projected at +24% by 2050 — long-run rental-demand tailwind backs the buy-and-hold thesis.
- 3 sale attempts; this cycle's ask has dropped $5k (6%) from the opening price — seller is motivated, your offer sets the floor, not the list.
- At projected returns (-3.0% appreciation + 5.1% rent growth), your $21k cash investment doubles in ~10 years — after that, you're playing with house money.
- Cap rate 7.6% vs local median 3.6% in Beechwood — top-decile yield for the area; either an underpriced asset or a hidden risk that comps aren't pricing in. Stress-test before assuming the spread holds.
Questions for listing agent
- It's been on market 38 days. Have you received any prior offers? Is the seller open to a 3% concession, seller financing, or rate buy-down credit?
- What does the HOA fee cover, when was the last increase, and are there any pending special assessments or reserve-fund shortfalls?
- Is there a deadline driving the sale (1031 exchange, divorce, estate, relocation)? That informs how much negotiation room exists.
- Schools are F-rated, which usually means shorter tenancies and higher turnover. Who's the typical renter profile here, and what's been the actual vacancy rate?
- What's the average days-on-market for RENTAL listings here right now (not sales)? A rising rental-DOM trend means longer vacancies and softer asking-rent achievability than the comps imply.
- What's the recent tenant-quality profile in this submarket — average credit score on applications, eviction rate, late-payment / NSF rate, and stable-employment percentage? A property-management company in the area should have these aggregated.
- How much new for-sale + rental construction is in the pipeline within 1–3 miles? Heavy new supply typically softens prices + rents 12–24 months out; constrained supply supports both.
CashFlowRE · CFR-7AX9YD03FE0207
· Data 3 weeks ago
cashflowre.app · 2026-05-29