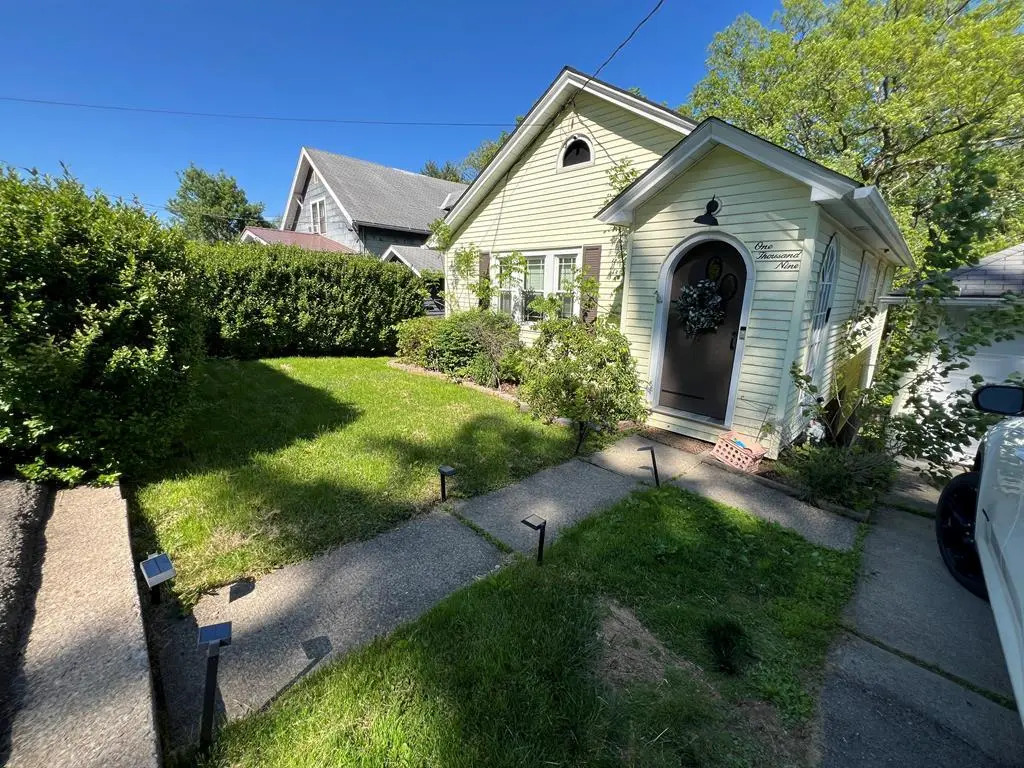
1009 Central Ave Ext
Woodland Heights, PA 16301
$127,900D-
2 bd · 1.0 ba ·
786 sqft ·
Built 1930
· SingleFamily
· Active
· 24 DOM
Cashflow @ list (25.0% down · 7.5%)
Estimated rent
$910/mo
Mortgage (P&I)
−$671
Tax + insurance
−$151
HOA
−$0
Vac / Maint / Mgmt
−$191
Net cashflow
$-103/mo
Annual
$-1,233/yr
Cap rate
5.33%
Cash-on-cash
-3.44%
DSCR
0.85
1% rule
0.71%
Cash to close
$35,812
Investor read
- This is a 2-bed/1.0-bath single-family listed at $128k.
- At list price, monthly cash flow is $-103 ($-1k/yr) — negative.
- To cash-flow at today's rent, offer at most $110k (14.2% below list).
- To meet the 1% rule (rent ≥ 1% of price), the offer needs to be $91k (28.9% below list).
- It's been on market 24 days — a 2% lower offer ($126k) is reasonable based on typical stale-listing flexibility.
- Recommended offer: $91k (28.9% below list) — sets the bar for 1% rule.
- In year one you build about $4k of equity ($884 loan paydown + $3k appreciation (2.2% local appreciation)).
- Location reads 70/100 on livability (#762 in PA) — a middle-class / working-renter tenant base. Strengths: crime A+, cost of living A+, housing A+; Watch: amenities F, commute F, employment F.
- Cranberry Area SD (rural): math 32% / reading 52% proficiency, ranked #327 of 539 in PA (top 61%) — families likely to look elsewhere, expect single-tenant / working-renter base with shorter leases.
- Zoned schools: Cranberry El Sch (math 29% / reading 53%, grade F, #932 of 1,518 statewide, top 62%, 606 students, 46% FRL); Cranberry Area Jshs (math 35% / reading 47%, grade F, #251 of 437 statewide, top 58%, 557 students, 41% FRL).
- Watch-outs: built in 1930 — expect roof / HVAC / electrical / plumbing capex.
- Market conditions: 52 active listings in the ZIP; 2 comparable units currently listed for rent nearby; 42 units permitted in Venango County in 2024 (0 in 5+ unit buildings).
- Venango County population projected at -30% by 2050 — secular population decline; favor cash flow + early exit over multi-decade hold.
- 2 sale attempts since 2y ago; this cycle's ask has dropped $12k (8%) from the opening price — seller is motivated, your offer sets the floor, not the list.
- By year 9, paydown + projected appreciation supports a ~$31k cash-out refi (75% LTV) — recoverable capital for the next deal without selling this one.
Questions for listing agent
- What do current leases actually rent for vs. the listed asking? Can we see a recent rent roll and the last 12 months of T-12 income?
- Built in 1930 — when were the roof, HVAC, electrical panel, plumbing, and water heater last replaced?
- Is there a deadline driving the sale (1031 exchange, divorce, estate, relocation)? That informs how much negotiation room exists.
- Schools are D-rated, which usually means shorter tenancies and higher turnover. Who's the typical renter profile here, and what's been the actual vacancy rate?
- The area grade is low — what's the realistic commute time and amenity access for the typical tenant pool here? Any planned neighborhood developments (good or bad) we should know about?
- What's the average days-on-market for RENTAL listings here right now (not sales)? A rising rental-DOM trend means longer vacancies and softer asking-rent achievability than the comps imply.
- What's the recent tenant-quality profile in this submarket — average credit score on applications, eviction rate, late-payment / NSF rate, and stable-employment percentage? A property-management company in the area should have these aggregated.
- How much new for-sale + rental construction is in the pipeline within 1–3 miles? Heavy new supply typically softens prices + rents 12–24 months out; constrained supply supports both.
CashFlowRE · CFR-7BE9RDFXBSB85R
· Data 1 h ago
cashflowre.app · 2026-05-29