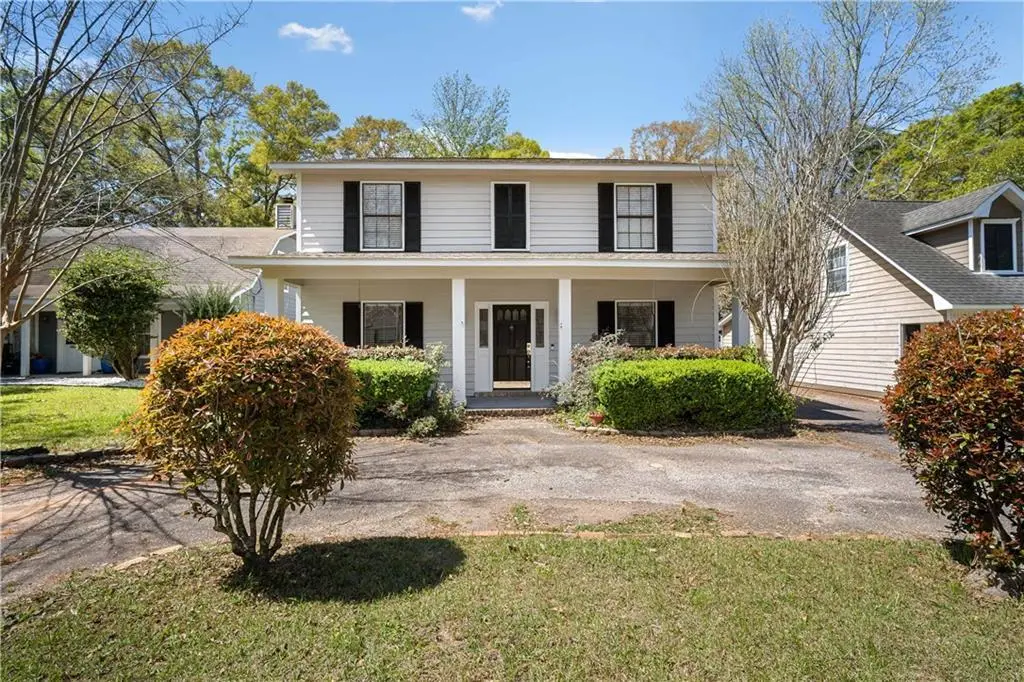
808 Henckley Ave
Mobile, AL 36609
$269,289D-
4 bd · 3.0 ba ·
2,460 sqft ·
Built 1979
· SingleFamily
· Active
· 86 DOM
Cashflow @ list (25.0% down · 7.5%)
Estimated rent
$2,053/mo
Mortgage (P&I)
−$1,412
Tax + insurance
−$236
HOA
−$0
Vac / Maint / Mgmt
−$431
Net cashflow
$-26/mo
Annual
$-314/yr
Cap rate
6.18%
Cash-on-cash
-0.42%
DSCR
0.98
1% rule
0.76%
Cash to close
$75,401
Investor read
- This is a 4-bed/3.0-bath single-family listed at $269k.
- At list price, monthly cash flow is $-26 ($-314/yr) — negative.
- To cash-flow at today's rent, offer at most $265k (1.7% below list).
- To meet the 1% rule (rent ≥ 1% of price), the offer needs to be $205k (23.7% below list).
- It's been on market 86 days — a 6% lower offer ($253k) is reasonable based on typical stale-listing flexibility.
- Recommended offer: $205k (23.7% below list) — sets the bar for 1% rule.
- Local home prices are declining (-3.0%/yr); year-one equity from $2k of loan paydown is wiped out by about $8k of value loss. Plan a longer hold.
- Location reads 75/100 on livability (#20 in AL, #4,262 nationally) — a middle-class / working-renter tenant base. Strengths: commute A+, cost of living A+, housing A+; Watch: schools D-, crime F, employment D-.
- Mobile County (urban): math 15% / reading 39% proficiency, ranked #81 of 129 in AL (top 63%) — low school quality limits family demand, transient renter base, plan for 1-2y turnover; 67% free/reduced lunch — lower-income household profile, screen leases tightly.
- Market conditions: Rents rising (+3.1%/yr); 144 active listings in the ZIP; 5 comparable units currently listed for rent nearby; rentals lingering (median 44d on market — plan ~5-8 weeks vacancy on turnover, expect pricing pressure); 60% of comp listings sitting > 30 days — soft ceiling on asking rent; 1,678 units permitted in Mobile County in 2024 (264 in 5+ unit buildings).
- Mobile County population projected to shrink 8% by 2050 — rents likely to lag national; underwrite the cash flow, not the appreciation.
- Climate carrying-cost: severe wind risk, 99% chance of damaging wind over 30y; extreme-heat days projected 7→21/yr by 2055 (HVAC capex compounding) — expect insurance premiums to compound above CPI over the hold.
- Cap rate 6.2% vs local median 4.9% in Mobile — meaningfully above typical; check what's discounted (condition, days-on-market, listing class) to confirm the premium yield is real.
- At $2,053/mo this rent would consume 49% of the median local household income ($50k/yr) (locally 1379% of renters already pay >50% of income on rent) — very limited rent-growth headroom before tenants either downsize or default.
Questions for listing agent
- What do current leases actually rent for vs. the listed asking? Can we see a recent rent roll and the last 12 months of T-12 income?
- It's been on market 86 days. Have you received any prior offers? Is the seller open to a 24% concession, seller financing, or rate buy-down credit?
- Built in 1979 — when were the roof, HVAC, electrical panel, plumbing, and water heater last replaced?
- Why hasn't it sold? Are there any deal-killer items the seller is aware of (foundation, flood, title, zoning, code violations)?
- Is there a deadline driving the sale (1031 exchange, divorce, estate, relocation)? That informs how much negotiation room exists.
- Schools are D-rated, which usually means shorter tenancies and higher turnover. Who's the typical renter profile here, and what's been the actual vacancy rate?
- Crime grade is F in this area — have there been break-ins, vandalism, or insurance claims at this property in the last 3 years? What carrier currently insures it and at what premium?
- The area grade is low — what's the realistic commute time and amenity access for the typical tenant pool here? Any planned neighborhood developments (good or bad) we should know about?
CashFlowRE · CFR-7CFPPKFRW8GYNJ
· Data 2 days ago
cashflowre.app · 2026-05-29