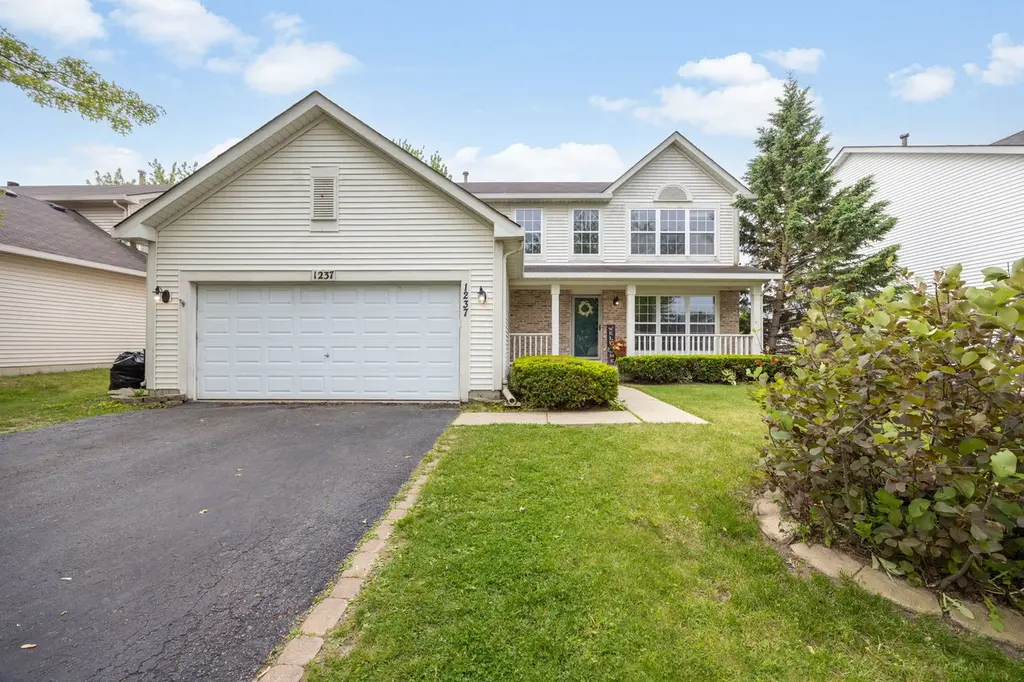
1237 E Greystone Dr
Round Lake Beach, IL 60073
$399,900F
3 bd · 2.5 ba ·
2,313 sqft ·
Built 2000
· SingleFamily
· Active
· 23 DOM
Cashflow @ list (25.0% down · 7.5%)
Estimated rent
$2,894/mo
Mortgage (P&I)
−$2,097
Tax + insurance
−$516
HOA
−$27
Vac / Maint / Mgmt
−$608
Net cashflow
$-354/mo
Annual
$-4,247/yr
Cap rate
5.23%
Cash-on-cash
-3.79%
DSCR
0.83
1% rule
0.72%
Cash to close
$111,972
Investor read
- This is a 3-bed/2.5-bath single-family listed at $400k.
- At list price, monthly cash flow is $-354 ($-4k/yr) — negative.
- To cash-flow at today's rent, offer at most $337k (15.6% below list).
- To meet the 1% rule (rent ≥ 1% of price), the offer needs to be $289k (27.6% below list).
- It's been on market 23 days — a 2% lower offer ($394k) is reasonable based on typical stale-listing flexibility.
- Recommended offer: $289k (27.6% below list) — sets the bar for 1% rule.
- Local home prices are declining (-3.0%/yr); year-one equity from $3k of loan paydown is wiped out by about $12k of value loss. Plan a longer hold.
- Location reads 79/100 on livability (#125 in IL, #2,172 nationally) — a middle-class / working-renter tenant base. Strengths: crime A+, cost of living A+, housing A+; Watch: commute F.
- Grayslake Chsd 127 (suburban): math 40% / reading 44% proficiency, ranked #95 of 620 in IL (top 15%) — families likely to look elsewhere, expect single-tenant / working-renter base with shorter leases.
- Zoned schools: Grayslake North High School (math 37% / reading 42%, grade F, #88 of 693 statewide, top 14%, 1,257 students, 0% FRL).
- Market conditions: Rents rising (+2.9%/yr); 97 active listings in the ZIP; 2 comparable units currently listed for rent nearby; solid renter incomes; 948 units permitted in Lake County in 2024 (424 in 5+ unit buildings).
- Lake County population projected to shrink 8% by 2050 — rents likely to lag national; underwrite the cash flow, not the appreciation.
- 6 sale attempts since 8y ago; this cycle's ask is 70% above the opening price — seller raised mid-cycle; expect resistance to lowballs.
- Current owner paid $235k; list at $400k implies a 70% gain — meaningful room to come down on a strong offer.
- This rent runs 35% of the median local income ($99k/yr) — at the standard rent-burdened threshold; future hikes will face affordability resistance.
Questions for listing agent
- What do current leases actually rent for vs. the listed asking? Can we see a recent rent roll and the last 12 months of T-12 income?
- What does the HOA fee cover, when was the last increase, and are there any pending special assessments or reserve-fund shortfalls?
- Is there a deadline driving the sale (1031 exchange, divorce, estate, relocation)? That informs how much negotiation room exists.
- Schools are F-rated, which usually means shorter tenancies and higher turnover. Who's the typical renter profile here, and what's been the actual vacancy rate?
- The area grade is low — what's the realistic commute time and amenity access for the typical tenant pool here? Any planned neighborhood developments (good or bad) we should know about?
- What's the average days-on-market for RENTAL listings here right now (not sales)? A rising rental-DOM trend means longer vacancies and softer asking-rent achievability than the comps imply.
- What's the recent tenant-quality profile in this submarket — average credit score on applications, eviction rate, late-payment / NSF rate, and stable-employment percentage? A property-management company in the area should have these aggregated.
- How much new for-sale + rental construction is in the pipeline within 1–3 miles? Heavy new supply typically softens prices + rents 12–24 months out; constrained supply supports both.
CashFlowRE · CFR-7DMBSVBTHJ0MQA
· Data 2 days ago
cashflowre.app · 2026-05-29