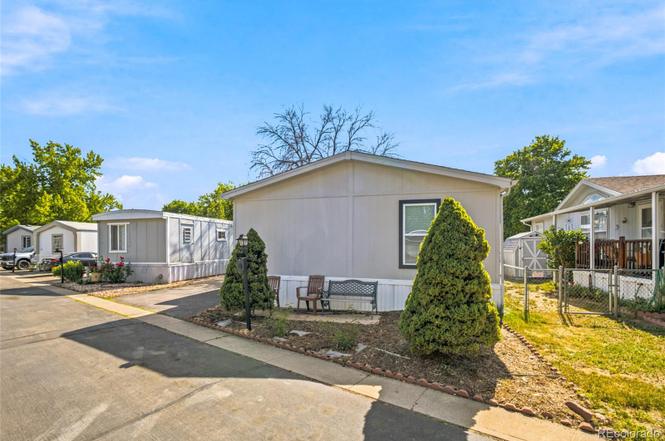
281 Skylark Cir
Lafayette, CO 80026
$140,000B
3 bd · 2.0 ba ·
1,056 sqft ·
Built 1999
· Manufactured
· Active
· 3 DOM
Cashflow @ list (25.0% down · 7.5%)
Estimated rent
$2,459/mo
Mortgage (P&I)
−$734
Tax + insurance
−$233
HOA
−$0
Vac / Maint / Mgmt
−$516
Net cashflow
$975/mo
Annual
$11,702/yr
Cap rate
14.65%
Cash-on-cash
29.85%
DSCR
2.33
1% rule
1.76%
Cash to close
$39,200
Investor read
- This is a 3-bed/2.0-bath manufactured listed at $140k.
- At list price, monthly cash flow is $975 ($12k/yr) — positive.
- The deal already cash-flows at list — no discount required.
- Meets the 1% rule at list price ($2k rent vs $140k).
- Only 3 days on market — expect competitive offers; lowballing is unlikely to land.
- Local home prices are declining (-3.0%/yr); year-one equity from $968 of loan paydown is wiped out by about $4k of value loss. Plan a longer hold.
- Location reads 85/100 on livability (#1 in CO, #566 nationally) — a professional / high-income tenant draw. Strengths: amenities A+, commute A+, employment A+; Watch: crime C-, cost of living F.
- Boulder Valley School District No. Re2 (urban): math 49% / reading 67% proficiency, ranked #6 of 86 in CO (top 7%) — acceptable for families but not a draw, mixed tenant base, ~2y average lease; only 16% free/reduced lunch — higher-income household profile.
- Zoned schools: Alicia Sanchez International School (math 5% / reading 22%, grade F, #824 of 966 statewide, top 88%, 343 students, 74% FRL); Angevine Middle School (math 29% / reading 47%, grade F, #90 of 270 statewide, top 34%, 661 students, 44% FRL); Centaurus High School (math 54% / reading 74%, grade B-, #38 of 381 statewide, top 10%, 1,525 students, 32% FRL) — zoned schools average 50% FRL vs 16% district-wide (34 pts higher); higher-poverty schools than district average — tighter screening recommended.
- Zoned-school proficiency averages 38% at this address vs 58% district-wide (-20 pts) — the specific schools serving this property underperform the Boulder Valley School District No. Re2 average; the district grade overstates school quality for this exact location.
- Market conditions: Rents rising (+1.6%/yr); 205 active listings in the ZIP; 13 comparable units currently listed for rent nearby; rentals at typical pace (median 15d on market — plan ~3-4 weeks tenant-placement turnaround); high-income renter base; 1,688 units permitted in Boulder County in 2024 (1,136 in 5+ unit buildings).
- Boulder County population projected at +40% by 2050 — long-run rental-demand tailwind backs the buy-and-hold thesis.
- At projected returns (-3.0% appreciation + 1.6% rent growth), your $39k cash investment doubles in ~5 years — after that, you're playing with house money.
- Cap rate 14.7% vs local median 2.6% in Lafayette — top-decile yield for the area; either an underpriced asset or a hidden risk that comps aren't pricing in. Stress-test before assuming the spread holds.
Questions for listing agent
- Is there a deadline driving the sale (1031 exchange, divorce, estate, relocation)? That informs how much negotiation room exists.
- Schools are B-rated — typically a magnet for longer-tenancy family renters. What's the average tenant stay here, and is there a school-zone premium baked into asking?
- What's the average days-on-market for RENTAL listings here right now (not sales)? A rising rental-DOM trend means longer vacancies and softer asking-rent achievability than the comps imply.
- What's the recent tenant-quality profile in this submarket — average credit score on applications, eviction rate, late-payment / NSF rate, and stable-employment percentage? A property-management company in the area should have these aggregated.
- How much new for-sale + rental construction is in the pipeline within 1–3 miles? Heavy new supply typically softens prices + rents 12–24 months out; constrained supply supports both.
CashFlowRE · CFR-7MFPGS4SK1B4AW
· Data 1 h ago
cashflowre.app · 2026-05-29