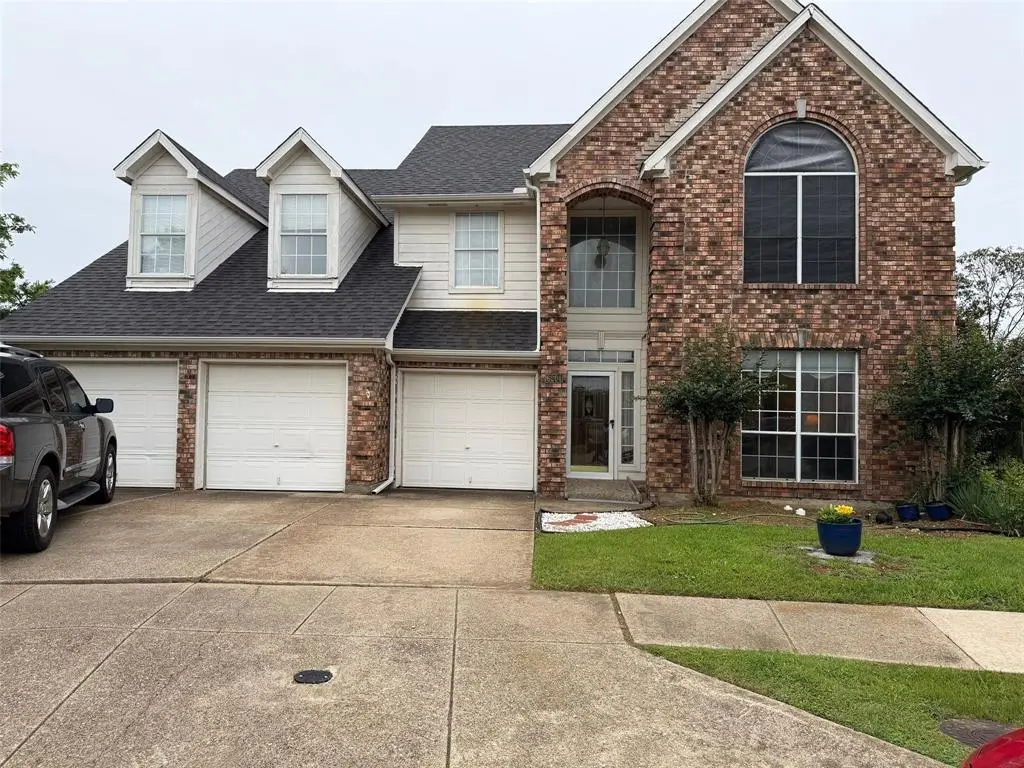
6204 High Brush Cir
Dallas, TX 75249
$299,000D+
5 bd · 3.5 ba ·
3,639 sqft ·
Built 1989
· SingleFamily
· Pending
· 2 DOM
Cashflow @ list (25.0% down · 7.5%)
Estimated rent
$3,277/mo
Mortgage (P&I)
−$1,568
Tax + insurance
−$1,021
HOA
−$36
Vac / Maint / Mgmt
−$688
Net cashflow
$-36/mo
Annual
$-432/yr
Cap rate
6.15%
Cash-on-cash
-0.52%
DSCR
0.98
1% rule
1.10%
Cash to close
$83,720
Investor read
- This is a 5-bed/3.5-bath single-family listed at $299k.
- At list price, monthly cash flow is $-36 ($-432/yr) — negative.
- To cash-flow at today's rent, offer at most $293k (2.1% below list).
- Meets the 1% rule at list price ($3k rent vs $299k).
- Only 2 days on market — expect competitive offers; lowballing is unlikely to land.
- Recommended offer: $293k (2.1% below list) — sets the bar for cash-flow.
- Local home prices are declining (-3.0%/yr); year-one equity from $2k of loan paydown is wiped out by about $9k of value loss. Plan a longer hold.
- Location reads 81/100 on livability (#24 in TX, #1,380 nationally) — a professional / high-income tenant draw. Strengths: amenities A+, commute A+, housing A+; Watch: crime F.
- Duncanville ISD (suburban): math 20% / reading 29% proficiency, ranked #711 of 826 in TX (top 86%) — low school quality limits family demand, transient renter base, plan for 1-2y turnover; 68% free/reduced lunch — lower-income household profile, screen leases tightly.
- Zoned schools: Cj & Anne Hyman El (math 22% / reading 27%, grade F, #3,052 of 4,322 statewide, top 74%, 456 students, 77% FRL).
- Watch-outs: property tax is 3.6% of price.
- Market conditions: 50 active listings in the ZIP; 2 comparable units currently listed for rent nearby; solid renter incomes; 12,577 units permitted in Dallas County in 2024 (6,829 in 5+ unit buildings).
- Dallas County population projected at +35% by 2050 — long-run rental-demand tailwind backs the buy-and-hold thesis.
- 5 sale attempts since 15y ago with the ask held roughly flat each time — persistent listings suggest the price (not the market) is what's stuck; bring a comps-based counter.
- Climate carrying-cost: major wind risk, 27% chance of damaging wind over 30y; extreme-heat days projected 7→25/yr by 2055 (HVAC capex compounding) — expect insurance premiums to compound above CPI over the hold.
- Cap rate 6.1% vs local median 2.3% in Dallas — top-decile yield for the area; either an underpriced asset or a hidden risk that comps aren't pricing in. Stress-test before assuming the spread holds.
- At $3,277/mo this rent would consume 46% of the median local household income ($86k/yr) (locally 363% of renters already pay >50% of income on rent) — very limited rent-growth headroom before tenants either downsize or default.
Questions for listing agent
- What do current leases actually rent for vs. the listed asking? Can we see a recent rent roll and the last 12 months of T-12 income?
- Property tax is high relative to price — has the assessment been appealed recently, and will the sale trigger a re-assessment?
- What does the HOA fee cover, when was the last increase, and are there any pending special assessments or reserve-fund shortfalls?
- Is there a deadline driving the sale (1031 exchange, divorce, estate, relocation)? That informs how much negotiation room exists.
- Crime grade is F in this area — have there been break-ins, vandalism, or insurance claims at this property in the last 3 years? What carrier currently insures it and at what premium?
- The area grade is low — what's the realistic commute time and amenity access for the typical tenant pool here? Any planned neighborhood developments (good or bad) we should know about?
- What's the average days-on-market for RENTAL listings here right now (not sales)? A rising rental-DOM trend means longer vacancies and softer asking-rent achievability than the comps imply.
- What's the recent tenant-quality profile in this submarket — average credit score on applications, eviction rate, late-payment / NSF rate, and stable-employment percentage? A property-management company in the area should have these aggregated.
CashFlowRE · CFR-7QD8NP829C2085
· Data 1 week ago
cashflowre.app · 2026-05-29