17086 Esperanza Dr
Lake Mathews, CA 92570
$340,000F
2 bd · 2.0 ba ·
1,152 sqft ·
Built 1973
· Manufactured
· Active
· 302 DOM
Cashflow @ list (25.0% down · 7.5%)
Estimated rent
$2,649/mo
Mortgage (P&I)
−$1,783
Tax + insurance
−$430
HOA
−$0
Vac / Maint / Mgmt
−$556
Net cashflow
$-120/mo
Annual
$-1,442/yr
Cap rate
5.87%
Cash-on-cash
-1.51%
DSCR
0.93
1% rule
0.78%
Cash to close
$95,200
Investor read
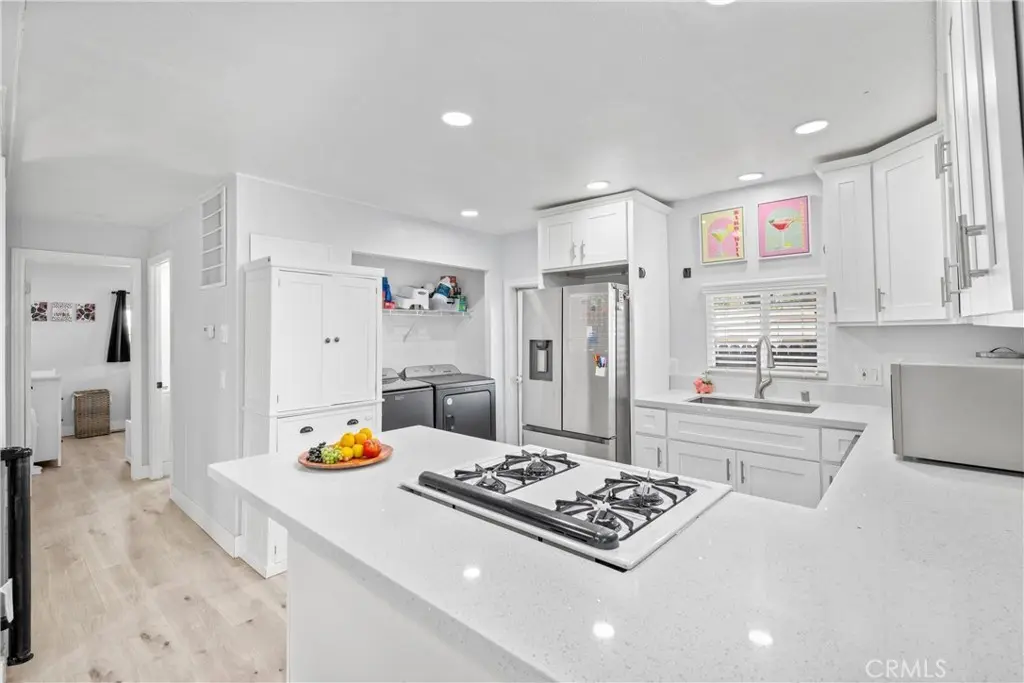
- This is a 2-bed/2.0-bath manufactured listed at $340k.
- At list price, monthly cash flow is $-120 ($-1k/yr) — negative.
- To cash-flow at today's rent, offer at most $319k (6.2% below list).
- To meet the 1% rule (rent ≥ 1% of price), the offer needs to be $265k (22.1% below list).
- It's been on market 302 days — a 12% lower offer ($299k) is reasonable based on typical stale-listing flexibility.
- Recommended offer: $265k (22.1% below list) — sets the bar for 1% rule.
- Local home prices are declining (-3.0%/yr); year-one equity from $2k of loan paydown is wiped out by about $10k of value loss. Plan a longer hold.
- Location reads 50/100 on livability (#1,102 in CA) — a working-class tenant base; expect higher turnover. Strengths: employment A+, housing A+; Watch: schools F, amenities F, commute F.
- Val Verde Unified (suburban): math 28% / reading 44% proficiency, ranked #820 of 1,400 in CA (top 59%) — families likely to look elsewhere, expect single-tenant / working-renter base with shorter leases; 66% free/reduced lunch — lower-income household profile, screen leases tightly.
- Market conditions: 205 active listings in the ZIP; 2 comparable units currently listed for rent nearby; solid renter incomes; 9,195 units permitted in Riverside County in 2024 (1,512 in 5+ unit buildings).
- Riverside County population projected at +22% by 2050 — long-run rental-demand tailwind backs the buy-and-hold thesis.
- 5 sale attempts since 21y ago with the ask held roughly flat each time — persistent listings suggest the price (not the market) is what's stuck; bring a comps-based counter.
- Climate carrying-cost: severe wildfire risk; extreme-heat days projected 7→18/yr by 2055 (HVAC capex compounding) — expect insurance premiums to compound above CPI over the hold.
- Cap rate 5.9% vs local median 1.9% in Lake Mathews — top-decile yield for the area; either an underpriced asset or a hidden risk that comps aren't pricing in. Stress-test before assuming the spread holds.
- This rent runs 40% of the median local income ($79k/yr) — at the standard rent-burdened threshold; future hikes will face affordability resistance.
Questions for listing agent
- What do current leases actually rent for vs. the listed asking? Can we see a recent rent roll and the last 12 months of T-12 income?
- It's been on market 302 days. Have you received any prior offers? Is the seller open to a 22% concession, seller financing, or rate buy-down credit?
- Built in 1973 — when were the roof, HVAC, electrical panel, plumbing, and water heater last replaced?
- Why hasn't it sold? Are there any deal-killer items the seller is aware of (foundation, flood, title, zoning, code violations)?
- Is there a deadline driving the sale (1031 exchange, divorce, estate, relocation)? That informs how much negotiation room exists.
- Schools are F-rated, which usually means shorter tenancies and higher turnover. Who's the typical renter profile here, and what's been the actual vacancy rate?
- The area grade is low — what's the realistic commute time and amenity access for the typical tenant pool here? Any planned neighborhood developments (good or bad) we should know about?
- What's the average days-on-market for RENTAL listings here right now (not sales)? A rising rental-DOM trend means longer vacancies and softer asking-rent achievability than the comps imply.
CashFlowRE · CFR-7SCR2C3XWMSF02
· Data 2 days ago
cashflowre.app · 2026-05-29