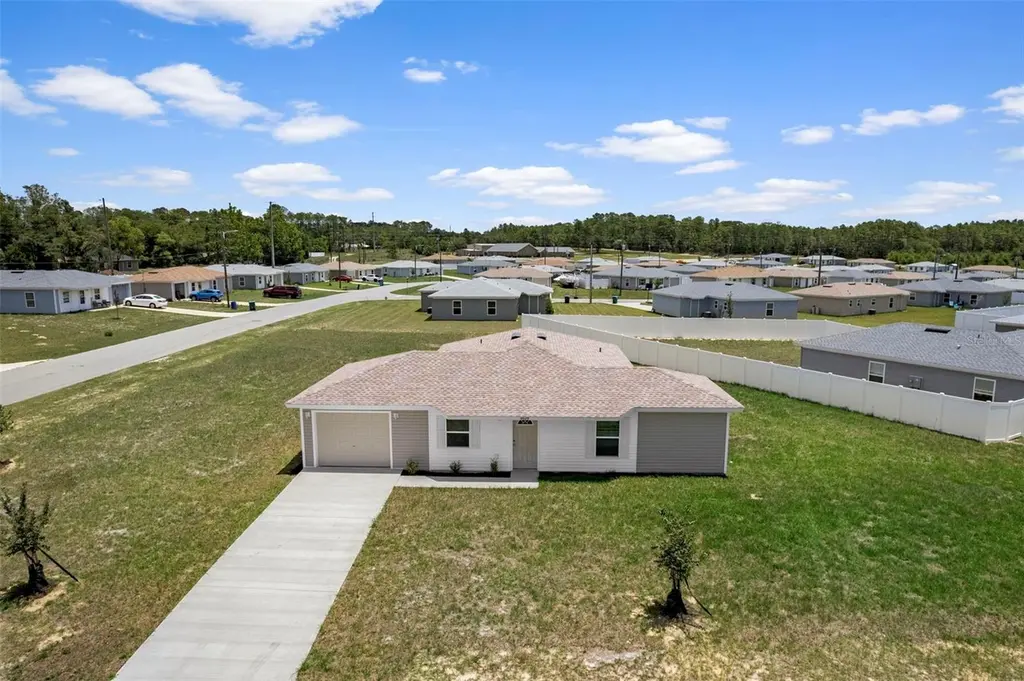
9929 N Allison Dr
Citrus Springs, FL 34434
$227,000D-
4 bd · 2.0 ba ·
1,411 sqft ·
Built 2026
· Land
· Pending
· 20 DOM
Cashflow @ list (25.0% down · 7.5%)
Estimated rent
$1,894/mo
Mortgage (P&I)
−$1,190
Tax + insurance
−$378
HOA
−$0
Vac / Maint / Mgmt
−$398
Net cashflow
$-72/mo
Annual
$-866/yr
Cap rate
5.91%
Cash-on-cash
-1.36%
DSCR
0.94
1% rule
0.83%
Cash to close
$63,560
Investor read
- This is a 4-bed/2.0-bath land listed at $227k.
- At list price, monthly cash flow is $-72 ($-866/yr) — negative.
- To cash-flow at today's rent, offer at most $217k (4.6% below list).
- To meet the 1% rule (rent ≥ 1% of price), the offer needs to be $189k (16.5% below list).
- It's been on market 20 days — a 2% lower offer ($224k) is reasonable based on typical stale-listing flexibility.
- Recommended offer: $189k (16.5% below list) — sets the bar for 1% rule.
- Local home prices are declining (-3.0%/yr); year-one equity from $2k of loan paydown is wiped out by about $7k of value loss. Plan a longer hold.
- Location reads 68/100 on livability (#521 in FL) — a middle-class / working-renter tenant base. Strengths: cost of living A+, housing A+; Watch: health & safety C-, employment D+, amenities F.
- Citrus (rural): math 49% / reading 50% proficiency, ranked #44 of 73 in FL (top 60%) — families likely to look elsewhere, expect single-tenant / working-renter base with shorter leases.
- Zoned schools: Citrus Springs Elementary School (math 52% / reading 48%, grade D+, #1,070 of 2,144 statewide, top 51%, 817 students, 71% FRL); Crystal River High School (math 31% / reading 44%, grade F, #336 of 667 statewide, top 51%, 1,249 students, 56% FRL).
- Market conditions: 1242 active listings in the ZIP; 19 comparable units currently listed for rent nearby; rentals at typical pace (median 21d on market — plan ~3-4 weeks tenant-placement turnaround); 2,443 units permitted in Citrus County in 2024 (0 in 5+ unit buildings).
- Citrus County population projected to shrink 10% by 2050 — rents likely to lag national; underwrite the cash flow, not the appreciation.
- 2 sale attempts with the ask held roughly flat each time — persistent listings suggest the price (not the market) is what's stuck; bring a comps-based counter.
- This rent runs 33% of the median local income ($69k/yr) — at the standard rent-burdened threshold; future hikes will face affordability resistance.
Questions for listing agent
- What do current leases actually rent for vs. the listed asking? Can we see a recent rent roll and the last 12 months of T-12 income?
- Is there a deadline driving the sale (1031 exchange, divorce, estate, relocation)? That informs how much negotiation room exists.
- The area grade is low — what's the realistic commute time and amenity access for the typical tenant pool here? Any planned neighborhood developments (good or bad) we should know about?
- What's the average days-on-market for RENTAL listings here right now (not sales)? A rising rental-DOM trend means longer vacancies and softer asking-rent achievability than the comps imply.
- What's the recent tenant-quality profile in this submarket — average credit score on applications, eviction rate, late-payment / NSF rate, and stable-employment percentage? A property-management company in the area should have these aggregated.
- How much new for-sale + rental construction is in the pipeline within 1–3 miles? Heavy new supply typically softens prices + rents 12–24 months out; constrained supply supports both.
CashFlowRE · CFR-7T44RA0WD64DBM
· Data 6 days ago
cashflowre.app · 2026-05-29