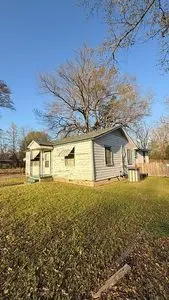
1723 S Texas St
Pine Bluff, AR 71601
$20,000B-
3 bd · 2.0 ba ·
1,472 sqft ·
Built 1988
· SingleFamily
· Active
· 24 DOM
Cashflow @ list (25.0% down · 7.5%)
Estimated rent
$737/mo
Mortgage (P&I)
−$105
Tax + insurance
−$40
HOA
−$0
Vac / Maint / Mgmt
−$155
Net cashflow
$437/mo
Annual
$5,250/yr
Cap rate
32.54%
Cash-on-cash
93.74%
DSCR
5.17
1% rule
3.68%
Cash to close
$5,600
Investor read
- This is a 3-bed/2.0-bath single-family listed at $20k.
- At list price, monthly cash flow is $437 ($5k/yr) — positive.
- The deal already cash-flows at list — no discount required.
- Meets the 1% rule at list price ($737 rent vs $20k).
- It's been on market 24 days — a 2% lower offer ($20k) is reasonable based on typical stale-listing flexibility.
- Recommended offer: $20k (1.5% below list) — sets the bar for market timing.
- Local home prices are declining (-3.0%/yr); year-one equity from $138 of loan paydown is wiped out by about $600 of value loss. Plan a longer hold.
- Location reads 50/100 on livability (#483 in AR) — a working-class tenant base; expect higher turnover. Strengths: cost of living A+, housing A; Watch: schools F, crime F, amenities F.
- Pine Bluff School District (urban): math 6% / reading 9% proficiency, ranked #236 of 238 in AR (top 99%) — low school quality limits family demand, transient renter base, plan for 1-2y turnover; 85% free/reduced lunch — lower-income household profile, screen leases tightly.
- Market conditions: 90 active listings in the ZIP; 5 comparable units currently listed for rent nearby; rentals lingering (median 44d on market — plan ~5-8 weeks vacancy on turnover, expect pricing pressure); 100% of comp listings sitting > 30 days — soft ceiling on asking rent; 62 units permitted in Jefferson County in 2024 (0 in 5+ unit buildings).
- Jefferson County population projected at -33% by 2050 — secular population decline; favor cash flow + early exit over multi-decade hold.
- At projected returns (-3.0% appreciation + 3.0% rent growth), your $6k cash investment doubles in ~2 years — after that, you're playing with house money.
- Climate carrying-cost: extreme-heat days projected 7→19/yr by 2055 (HVAC capex compounding) — expect insurance premiums to compound above CPI over the hold.
- Cap rate 32.5% vs local median 9.0% in Pine Bluff — top-decile yield for the area; either an underpriced asset or a hidden risk that comps aren't pricing in. Stress-test before assuming the spread holds.
Questions for listing agent
- Is there a deadline driving the sale (1031 exchange, divorce, estate, relocation)? That informs how much negotiation room exists.
- Schools are F-rated, which usually means shorter tenancies and higher turnover. Who's the typical renter profile here, and what's been the actual vacancy rate?
- Crime grade is F in this area — have there been break-ins, vandalism, or insurance claims at this property in the last 3 years? What carrier currently insures it and at what premium?
- What's the average days-on-market for RENTAL listings here right now (not sales)? A rising rental-DOM trend means longer vacancies and softer asking-rent achievability than the comps imply.
- What's the recent tenant-quality profile in this submarket — average credit score on applications, eviction rate, late-payment / NSF rate, and stable-employment percentage? A property-management company in the area should have these aggregated.
- How much new for-sale + rental construction is in the pipeline within 1–3 miles? Heavy new supply typically softens prices + rents 12–24 months out; constrained supply supports both.
CashFlowRE · CFR-7V2JFJEC3SCQW0
· Data 1 day ago
cashflowre.app · 2026-05-29