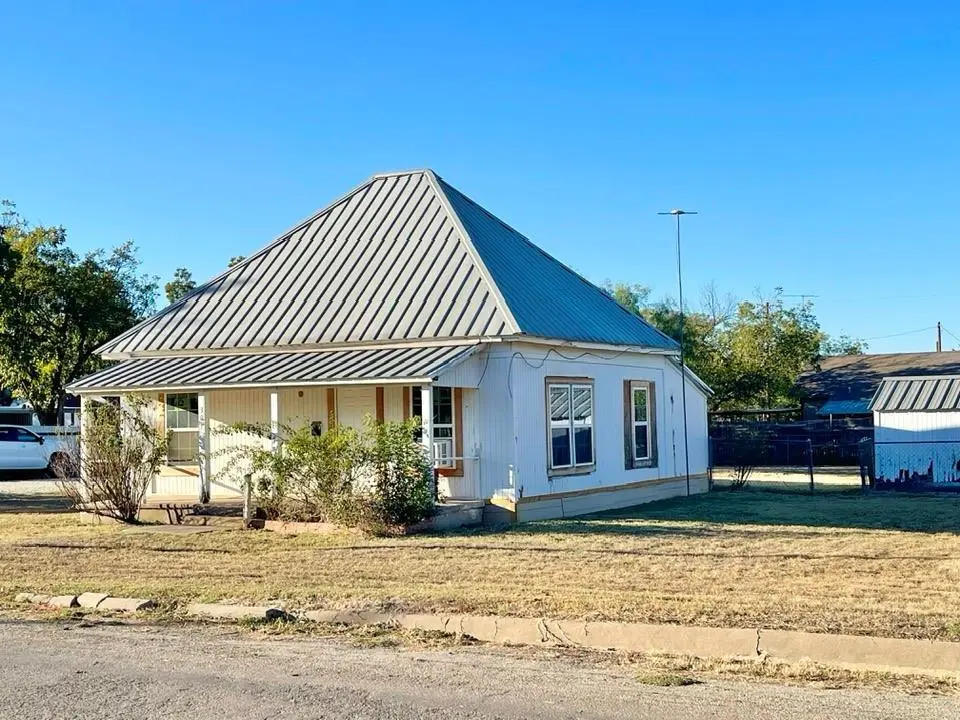
301 E 10th St
Coleman, TX 76834
$92,000D+
2 bd · 1.0 ba ·
864 sqft ·
Built 1920
· SingleFamily
· Active
· 128 DOM
Cashflow @ list (25.0% down · 7.5%)
Estimated rent
$834/mo
Mortgage (P&I)
−$482
Tax + insurance
−$173
HOA
−$0
Vac / Maint / Mgmt
−$175
Net cashflow
$3/mo
Annual
$42/yr
Cap rate
6.34%
Cash-on-cash
0.16%
DSCR
1.01
1% rule
0.91%
Cash to close
$25,760
Investor read
- This is a 2-bed/1.0-bath single-family listed at $92k.
- At list price, monthly cash flow is $3 ($42/yr) — positive.
- The deal already cash-flows at list — no discount required.
- To meet the 1% rule (rent ≥ 1% of price), the offer needs to be $83k (9.3% below list).
- It's been on market 128 days — a 12% lower offer ($81k) is reasonable based on typical stale-listing flexibility.
- Recommended offer: $81k (12.0% below list) — sets the bar for market timing.
- In year one you build about $6k of equity ($636 loan paydown + $5k appreciation (5.7% local appreciation)).
- Location reads 68/100 on livability (#454 in TX) — a middle-class / working-renter tenant base. Strengths: crime A+, cost of living A+, housing A+; Watch: health & safety D+, schools F, amenities F.
- Coleman ISD (town): math 42% / reading 39% proficiency, ranked #439 of 826 in TX (top 53%) — families likely to look elsewhere, expect single-tenant / working-renter base with shorter leases.
- Watch-outs: built in 1920 — expect roof / HVAC / electrical / plumbing capex.
- Market conditions: 119 active listings in the ZIP; 5 units permitted in Coleman County in 2024 (0 in 5+ unit buildings).
- Coleman County population projected at -28% by 2050 — secular population decline; favor cash flow + early exit over multi-decade hold.
- 4 sale attempts since 14y ago; this cycle's ask has dropped $7k (7%) from the opening price — seller is motivated, your offer sets the floor, not the list.
- At projected returns (5.7% appreciation + 3.0% rent growth), your $26k cash investment doubles in ~4 years — after that, you're playing with house money.
- By year 6, paydown + projected appreciation supports a ~$32k cash-out refi (75% LTV) — recoverable capital for the next deal without selling this one.
- Cap rate 6.3% vs local median 4.5% in Coleman — top-decile yield for the area; either an underpriced asset or a hidden risk that comps aren't pricing in. Stress-test before assuming the spread holds.
Questions for listing agent
- It's been on market 128 days. Have you received any prior offers? Is the seller open to a 12% concession, seller financing, or rate buy-down credit?
- Built in 1920 — when were the roof, HVAC, electrical panel, plumbing, and water heater last replaced?
- Why hasn't it sold? Are there any deal-killer items the seller is aware of (foundation, flood, title, zoning, code violations)?
- Is there a deadline driving the sale (1031 exchange, divorce, estate, relocation)? That informs how much negotiation room exists.
- Schools are F-rated, which usually means shorter tenancies and higher turnover. Who's the typical renter profile here, and what's been the actual vacancy rate?
- The area grade is low — what's the realistic commute time and amenity access for the typical tenant pool here? Any planned neighborhood developments (good or bad) we should know about?
- What's the average days-on-market for RENTAL listings here right now (not sales)? A rising rental-DOM trend means longer vacancies and softer asking-rent achievability than the comps imply.
- What's the recent tenant-quality profile in this submarket — average credit score on applications, eviction rate, late-payment / NSF rate, and stable-employment percentage? A property-management company in the area should have these aggregated.
CashFlowRE · CFR-7YHPMA02MFFD3P
· Data 2 days ago
cashflowre.app · 2026-05-29